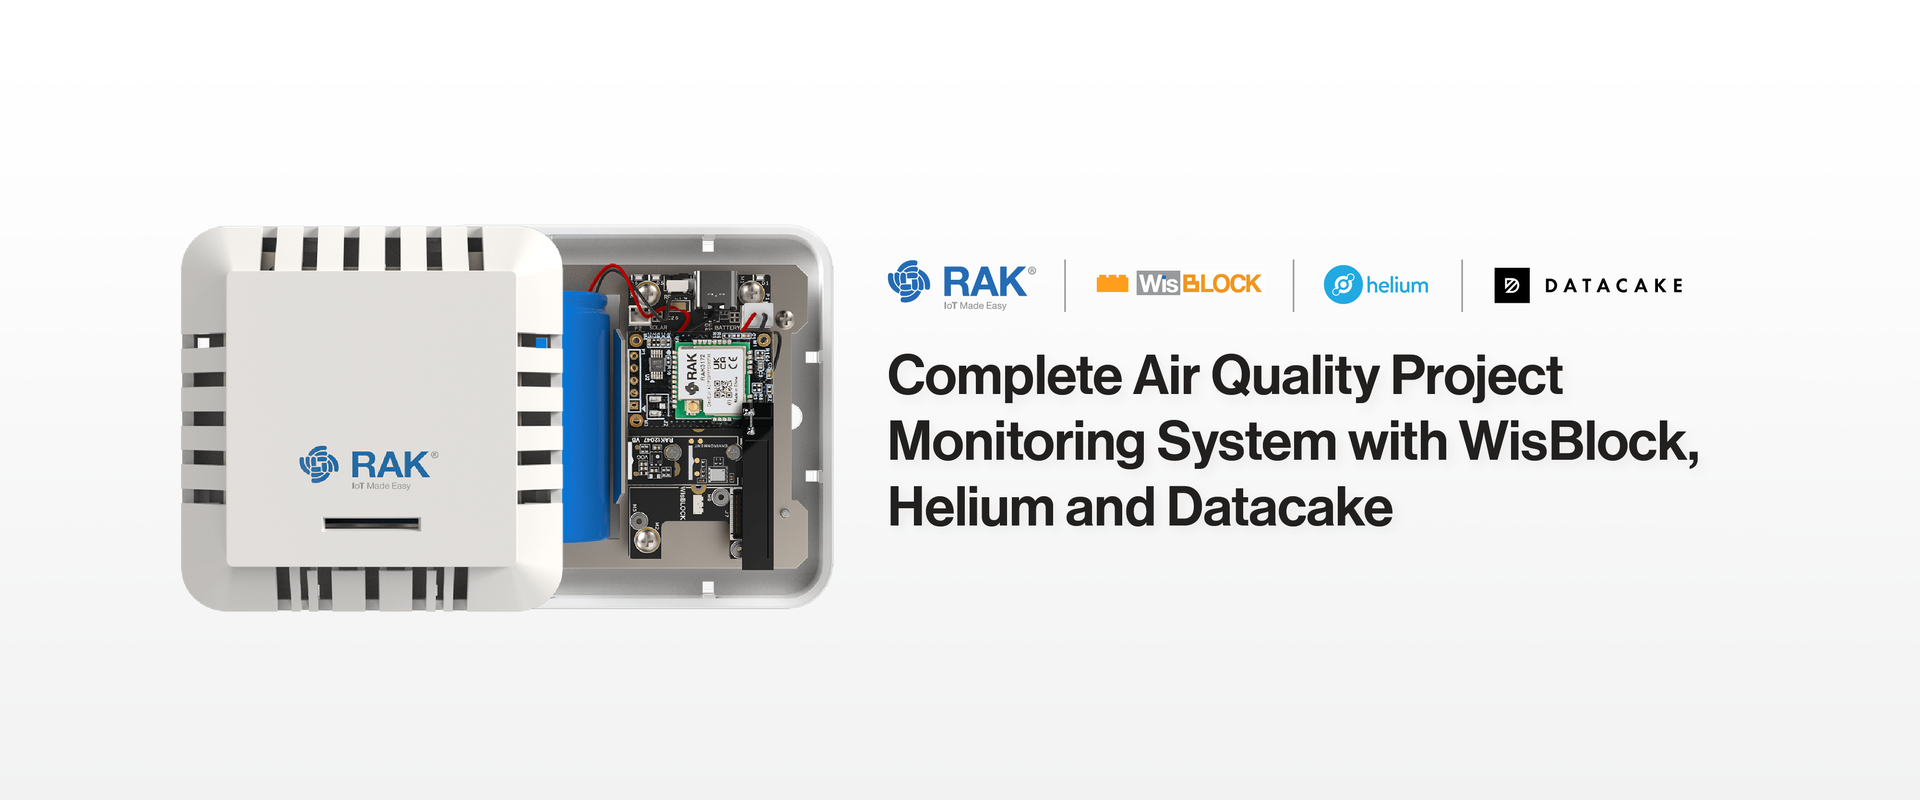
Make Sure Your Environment is Healthy with Helium, RAKwireless and RUI3

A healthy environment is important for our wellbeing. That includes the air around you.
Do you know if the air around you are good or if it is time to open a window and get some fresh air in?
With a few modules from our WisDuo and WisBlock product lines it is easy to detect bad environmental conditions.
For the impatient ones, you can jump directly to the step-by-step tutorial
- How is it working
- What is needed to build the sensor?
- How is the data flow?
- How do I build it in a step by step guide
How does our Wisblock Air Quality Monitoring System work
One option to measure the quality of the air is to measure the volatile organic compounds concentration (VOC). With the measured values of the Sensirion SGP40 and the Sensirion SHTC3, Sensirion VOC algorithm calculates the VOC index from 0 to 500.
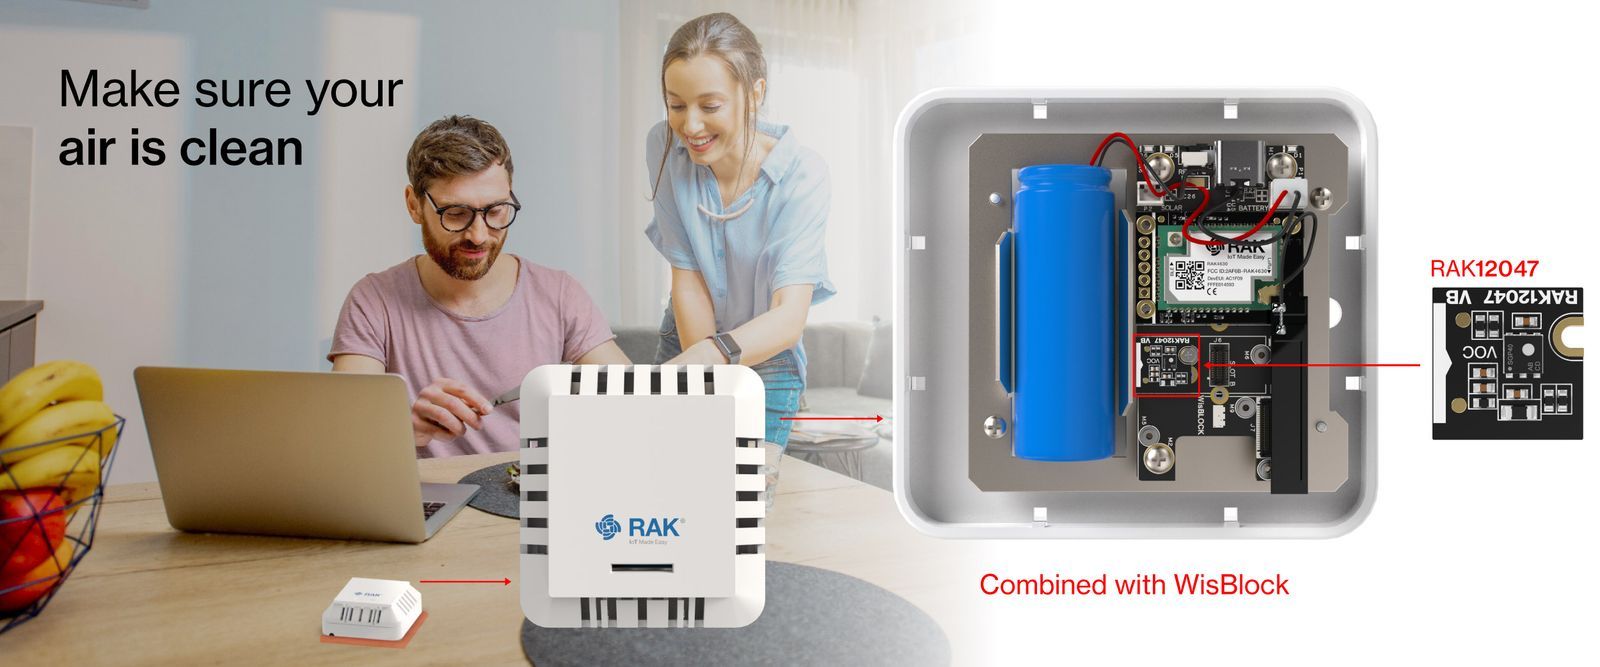
With the new WisBlock RAK12047 VOC sensor it is easy to build a sensor system for your house or office that measures the VOC index of the air. Based on the Sensirion SGP40 and using the Sensirion Gas Index Algorithm, it is just a Click. Code. Connect.! to build an air quality sensor.
The collected sensor data is transmitted over the Helium network to the Helium Console and then forwarded to the data processing tool Datacake.
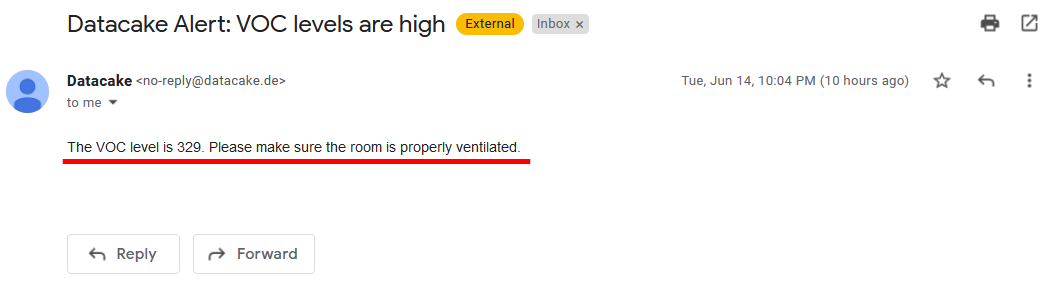
In Datacake the sensor values are not only visualized, but also analyzed and a warning is sent to you if the VOC index indicates an air quality level that is not good for you well doing.
The sensor can be battery powered and send the data every 2 minutes (configurable).
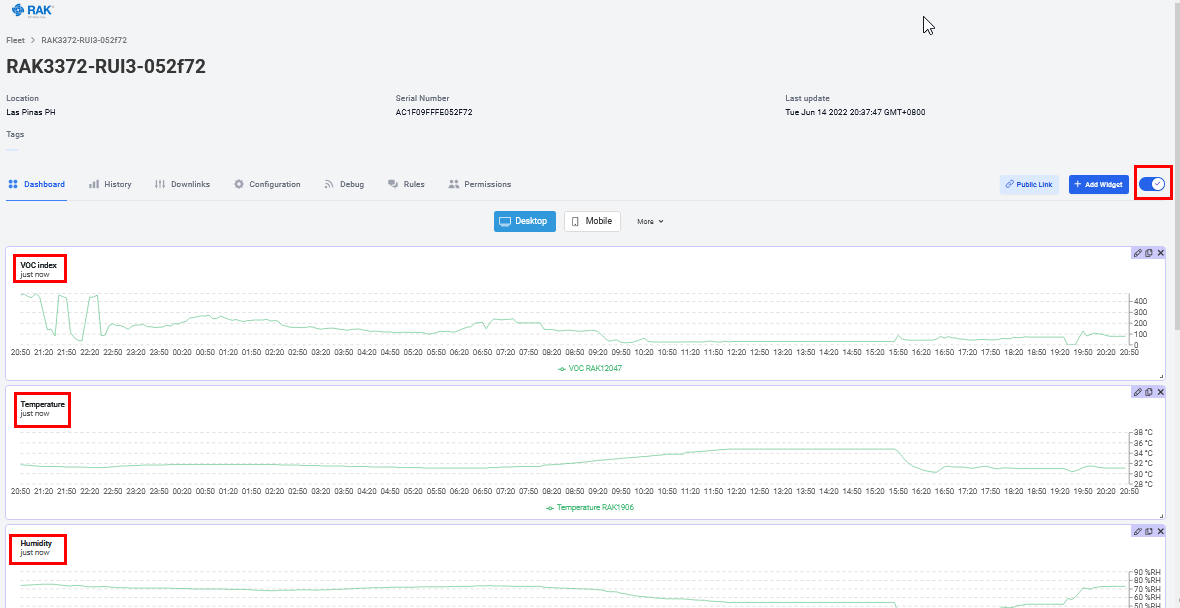
On Datacake the received values are visualized.
What is needed to build the sensor?
Only a few things are needed to create your own air quality sensor system:
- Source code for the VOC sensor application
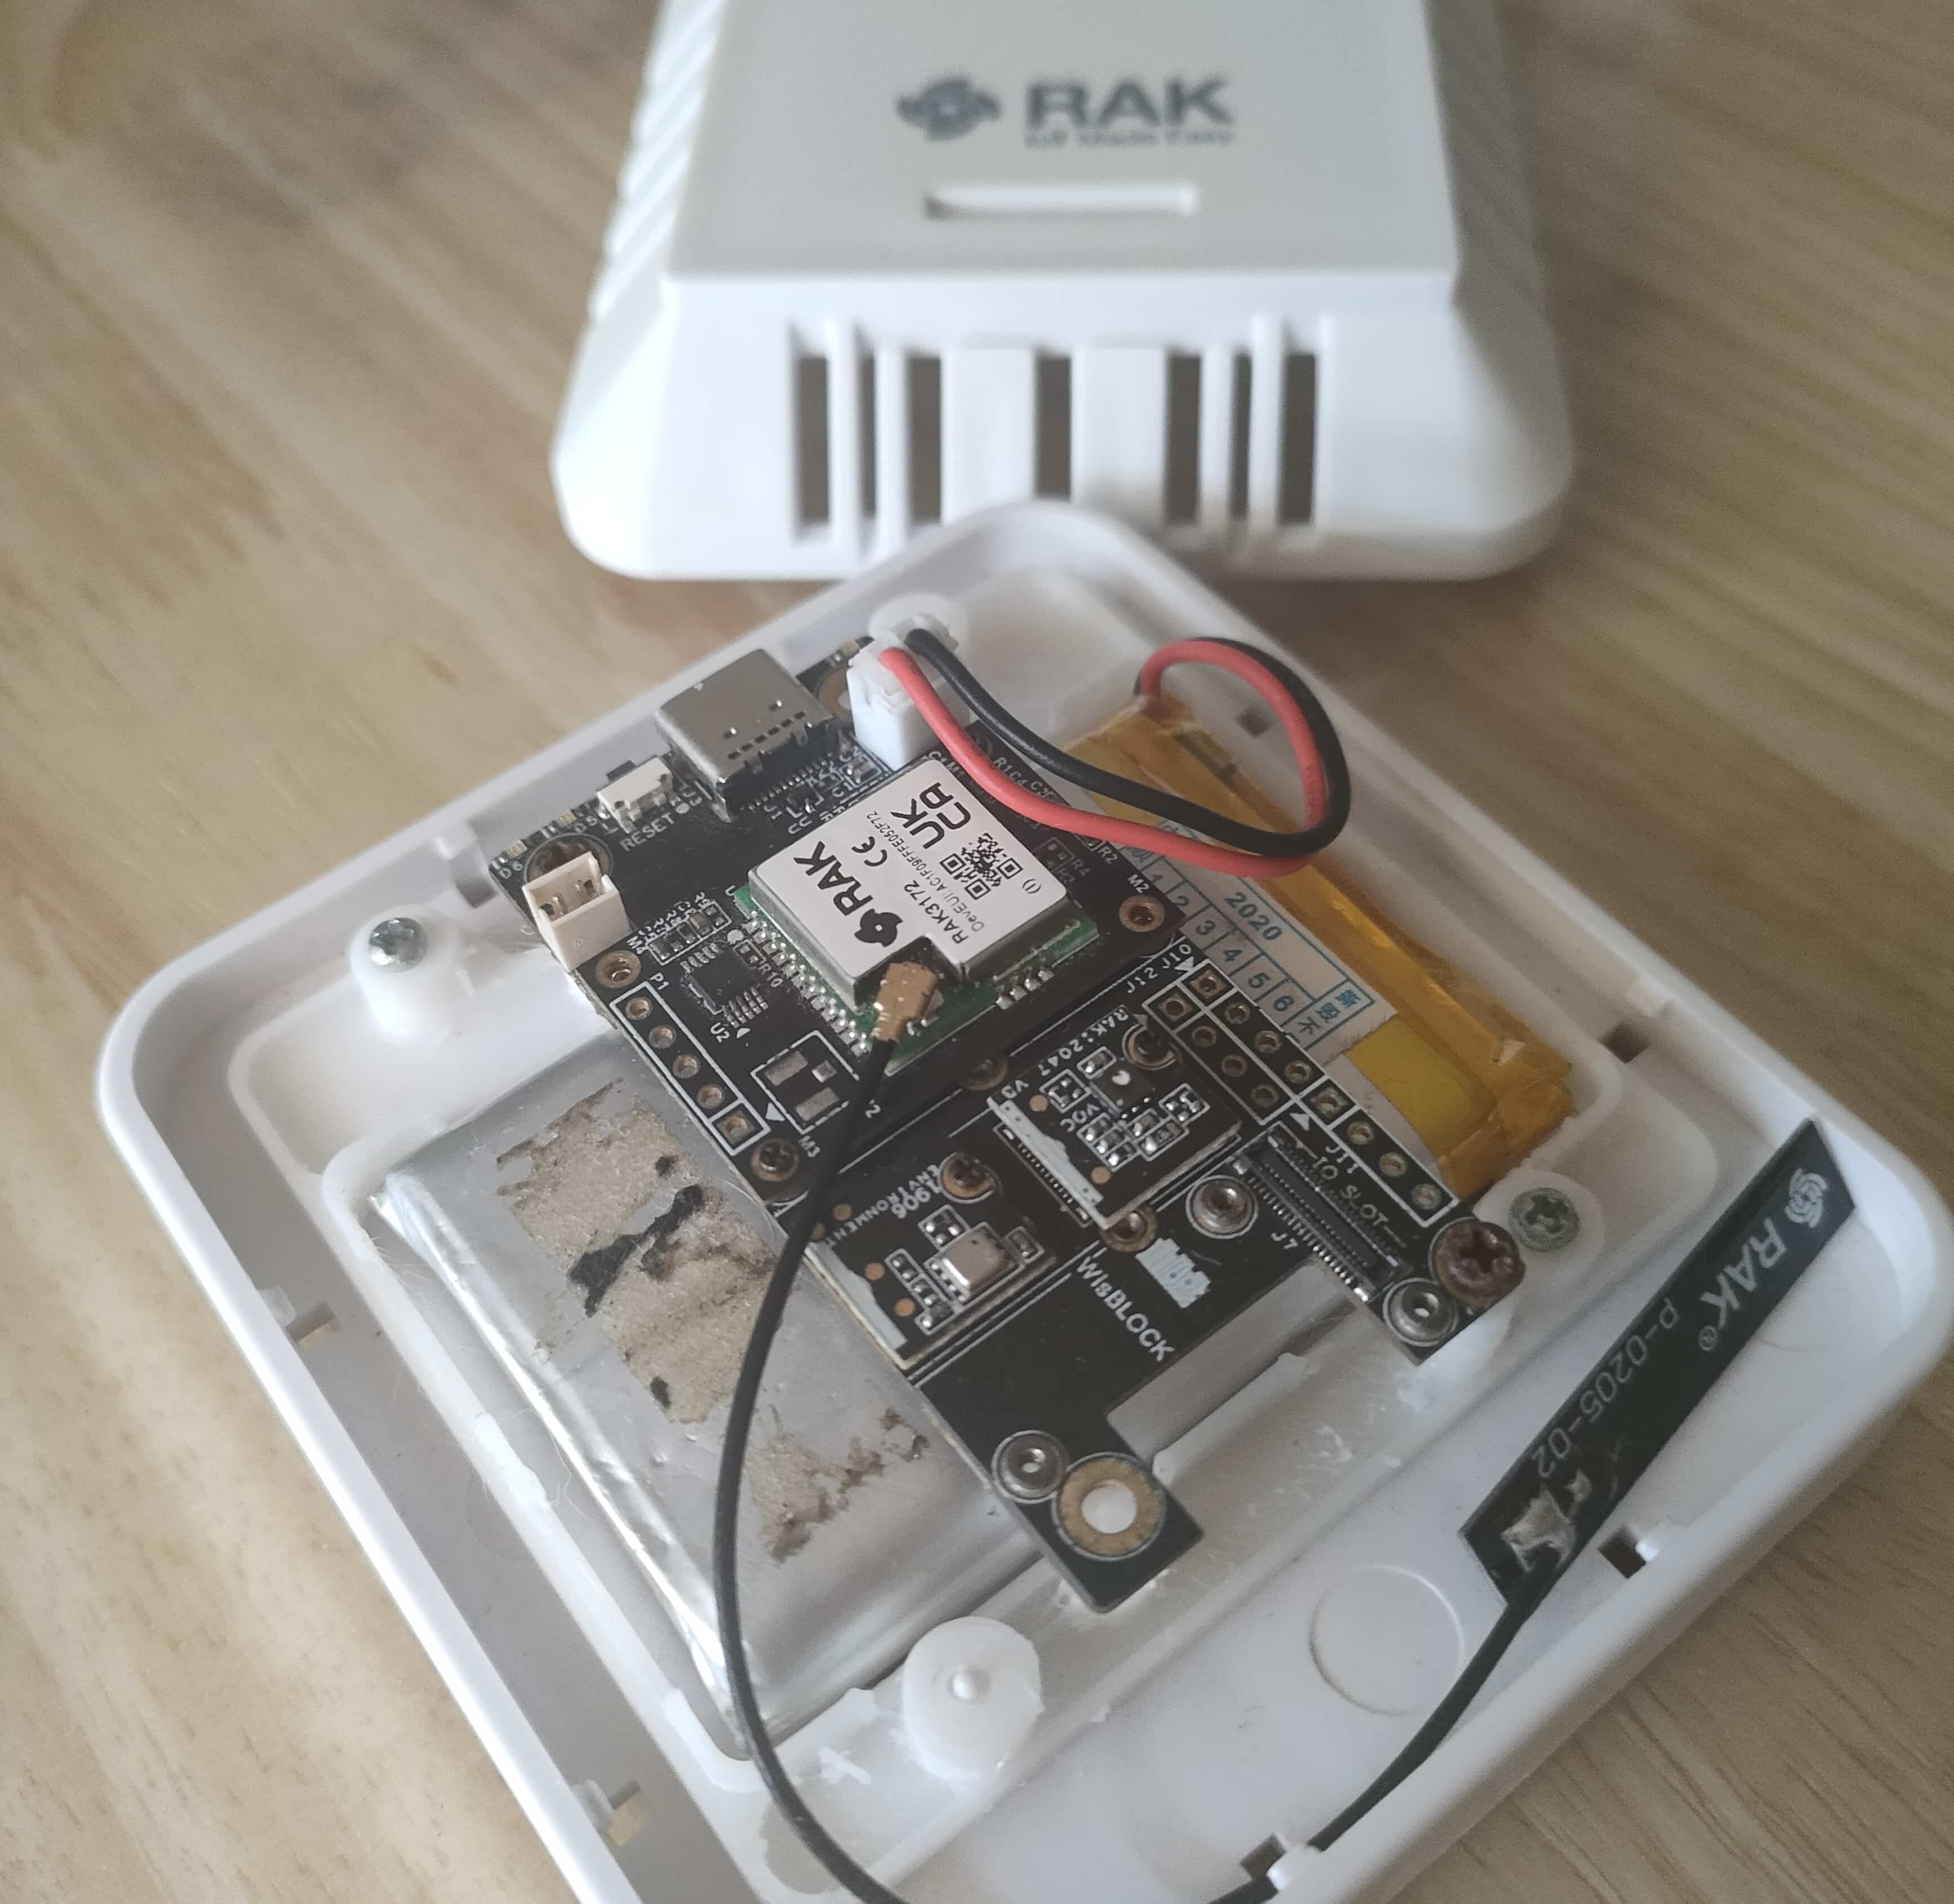
- Evaluation Board with the low power RAK3172 based on the STM32WL5 MCU => RAK3172 EVB
- VOC module with the Sensirion SGP40 sensor => RAK12047
- Temperature and Humidity module with the Sensirion SHTC3 sensor => RAK1901
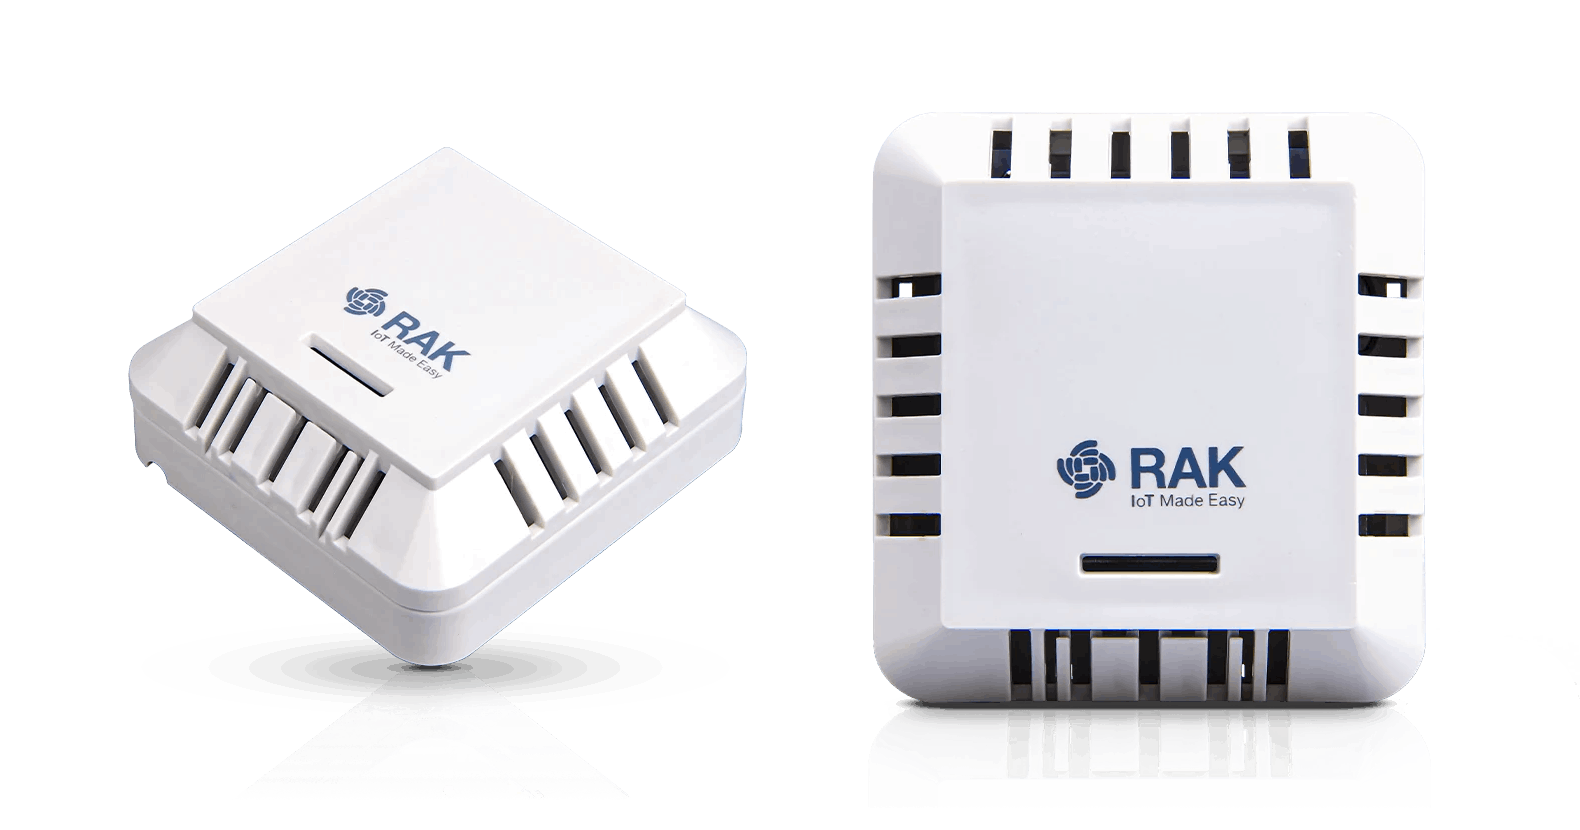
- RAKBox-B3 Indoor Enclosure
- A Helium Hotspot or nearby Helium Hotspots in range => RAKwireless Helium Hotspot
- Access to the Helium Console
- Account on Datacake
How is the data flow?
The WisBlock VOC sensor reads data every 10 seconds (configurable) from the RAK12047 sensor module. It submits the sensor readings to the Sensirion Gas Index Algorithm which calculates together with the temperature and humidity values of the RAK1901 sensor. Then the algorithm provides a VOC index between 0 and 500 which indicates the quality of the surrounding air, with a value of 100 as good and 500 as very bad.
The calculated VOC index is then sent every 2 minutes (configurable) over the Helium Network. In the Helium Console the VOC sensor device is registered and a flow to the Datacake integration is created. Now every time a data packet with the sensor data arrives, the Helium Console will forward it to Datacake.
In Datacake we setup the device and the visualization dashboard to see the measured values. In addition a rule is created that sends an alarm message if the VOC index is above a certain level. This rule sends a warning email to you to alert you about the bad air quality.
How do I build it in a step by step guide
Setting up the sensor device.
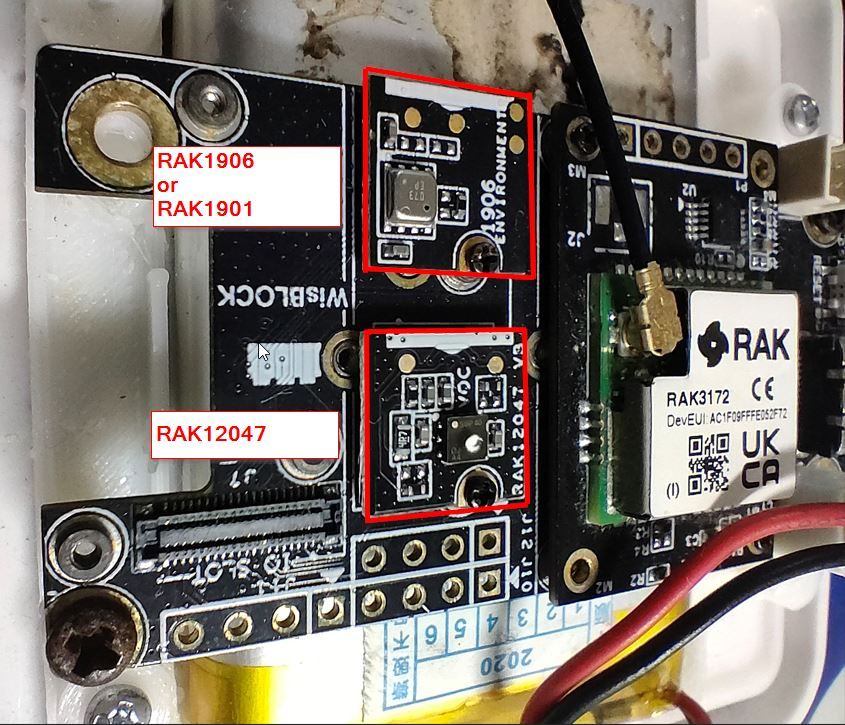
We are using the RAK3172-E Evaluation Board, which comes with the RAK5005-O Base Board. The Base Board has 4 sensor slots, where we place the RAK1901 and RAK12047 sensor modules into slots A and B.
Getting the sources
Next, we are downloading the application firmware to the RAK3172. The application firmware is based on the RUI3 API. The source code is hosted on Github.
Guides how to compile the application firmware and upload the code can be found in the RAKwireless Documentation Center .
Setting up the Sensor Node
After the firmware is loaded to the RAK3172, we setup the LoRaWAN credentials and other settings over the USB connection with AT commands.
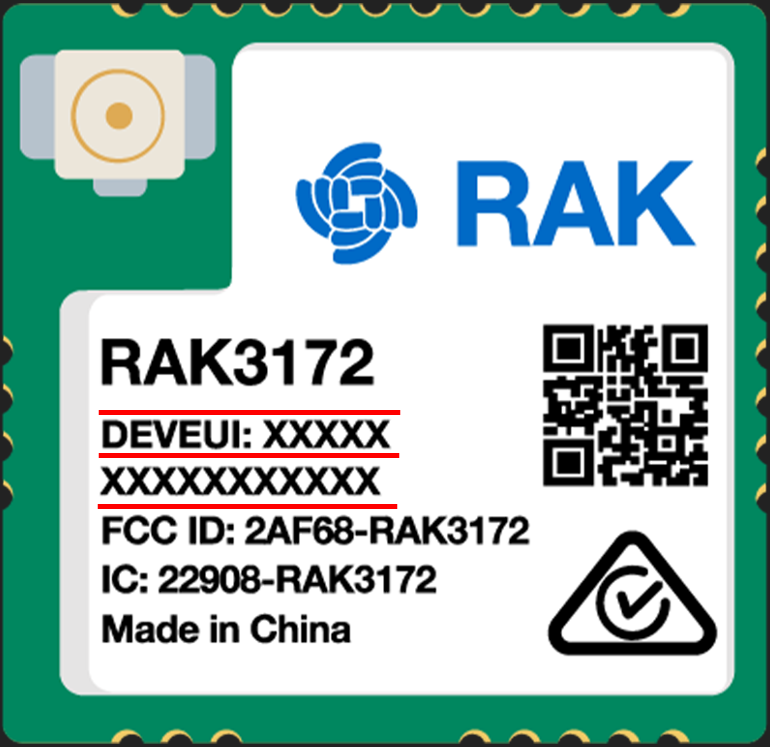
First we need to get the LoRaWAN credentials. The first one is the DevEUI, which is printed on the label of the RAK3172
Setting up the Sensor Node in Helium
The next two will be provided by the Helium Console. To get the required AppEUI and AppKey, log into the Helium Console and register a new device.
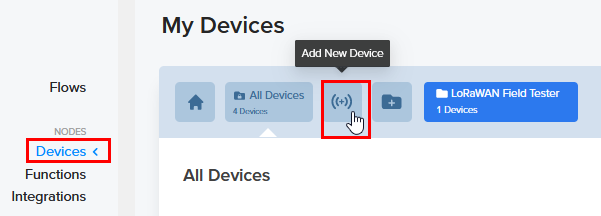
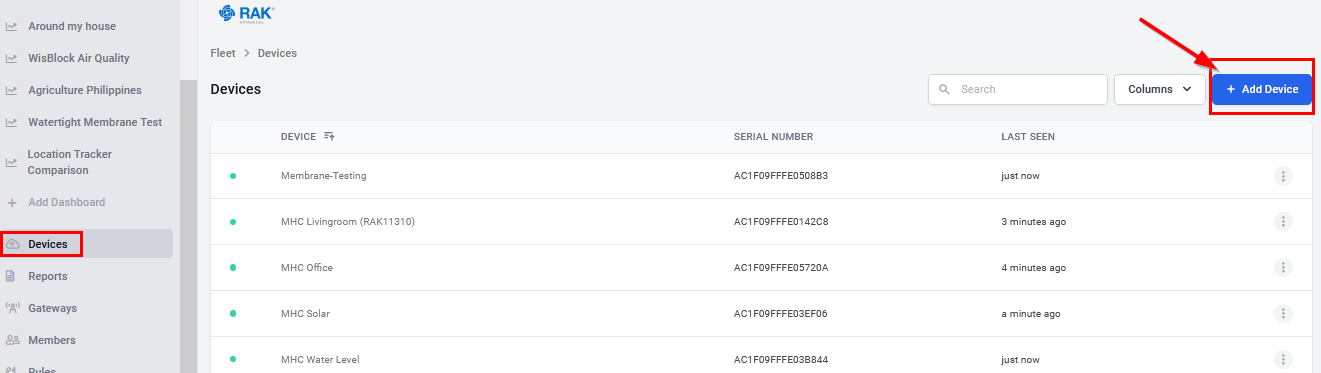
Go to the Devices tab and click on the new device icon
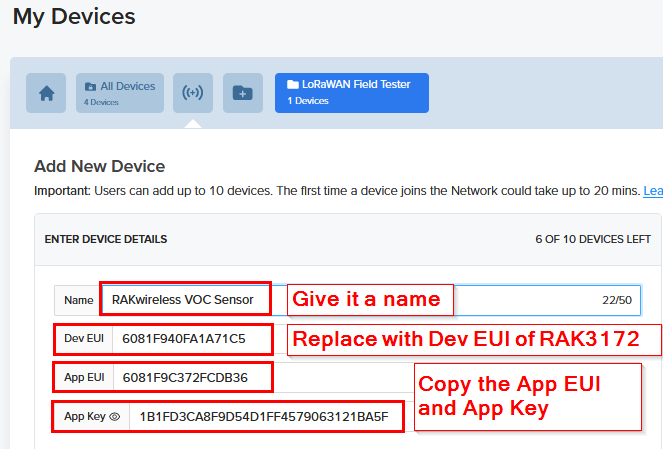
Replace the Dev EUI with the Dev EUI that is on the label of the RAK3172 and copy the App EUI and App Key (shown values are examples and should not be reused)
NOTE:
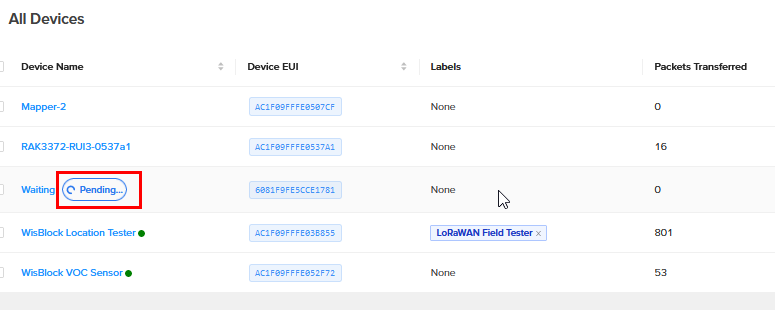
After creating a new device it will take several minutes before it is registered and can be used. Until then the new device is marked as PENDING:
Finish setup of the Sensor Node
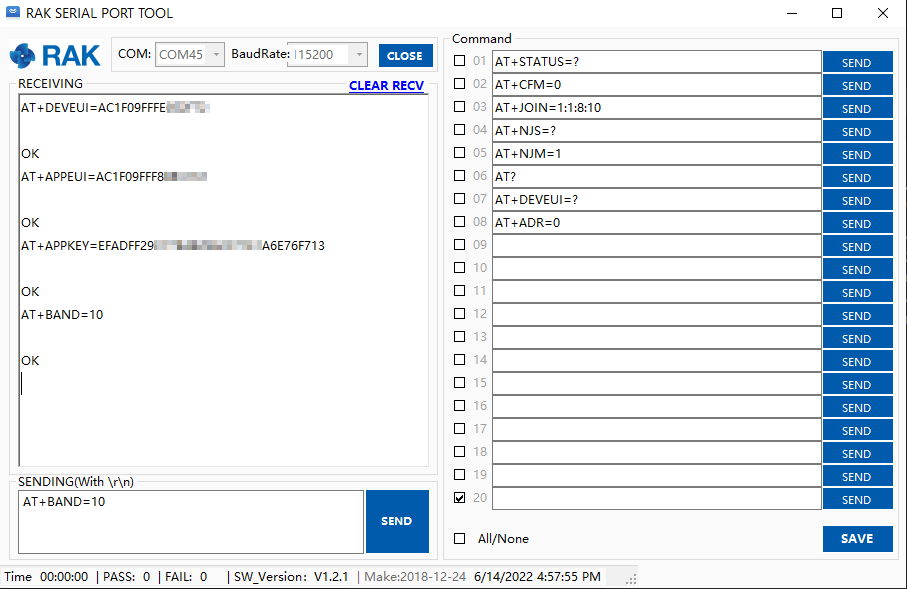
Now we need to setup the credentials in the RAK3172 using the AT command interface. Connect the Evaluation Board with the USB cable and start the RAK Serial Tool (or any other Serial Terminal application on your computer, select the COM port and 115200 as baud rate.
Only six commands are required for the setup (shown values are examples and should not be reused).
| Command | Meaning |
|---|---|
| AT+NJM=1 | Set LoRaWAN network mode |
| AT+DEVEUI=6081F940FA1A71C5 | Set Device EUI |
| AT+APPEUI=6081F9C372FCDB36 | Set Application EUI |
| AT+APPKEY=1B1FD3CA8F9D54D1FF4579063121BA5F | Set Application Key |
| AT+BAND=10 | Set LoRaWAN region (frequency band) |
| AT+JOIN=1:1 | Start network join process |
The complete AT command manual can be found in our RUI3 Documentation Center
For the AT+BAND command, it depends on the country you live in. Because LoRaWAN uses different frequency bands for different countries.
Here is an overview:
| Band | Region name | Region | Band | Region name | Region | Band | Region name | Region |
|---|---|---|---|---|---|---|---|---|
| 0 | EU433 | Europe | 4 | EU868 | Europe | 8 | AS923-1 | Asia |
| 1 | CN470 | China | 5 | US915 | North America | 9 | AS923-2 | Asia |
| 2 | RU864 | Russia | 6 | AU915 | Australia | 10 | AS923-3 | Asia |
| 3 | IN865 | India | 7 | KR920 | South Korea | 11 | AS923-4 | Israel |
And then the frequency for the packet transfer needs to be setup.
For this a custom AT command is defined in the code.ATC+SENDFREQ
This AT command expects the time between two data packets in seconds. The time is stored in the flash of the device and it is sufficient to setup the time one time. To save battery, the frequency should not be too often. Every two minutes is the interval I chose.
ATC+SENDFREQ=120
OK
Not the VOC sensor will send its data every 2 minutes.
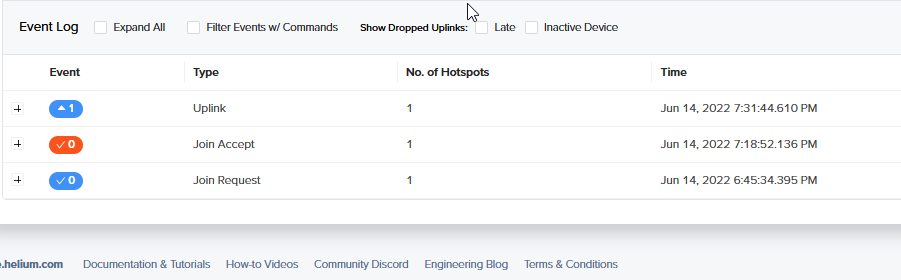
Once we have setup the device and registered in the Helium Console it can now join the network start sending its sensor data. You will see in the Helium Console the incoming data packets.
Setup Helium data flow
Once this is achieved the data flow in the Helium Console needs to be setup.
First we need an encoder for the incoming data. To make it easy, a matching decoder is available in the same Github repository where the source codes. You can download the Helium-Ext-LPP-Decoder.js from the decoders folder.
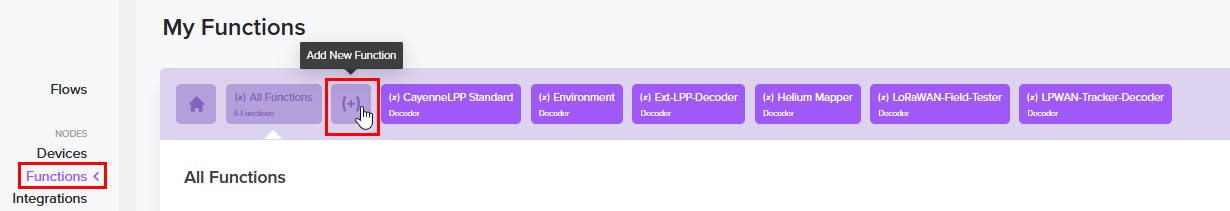
You can use this decoder in the Helium Console by creating a new Function. Go to the Functions tab and click on New Function
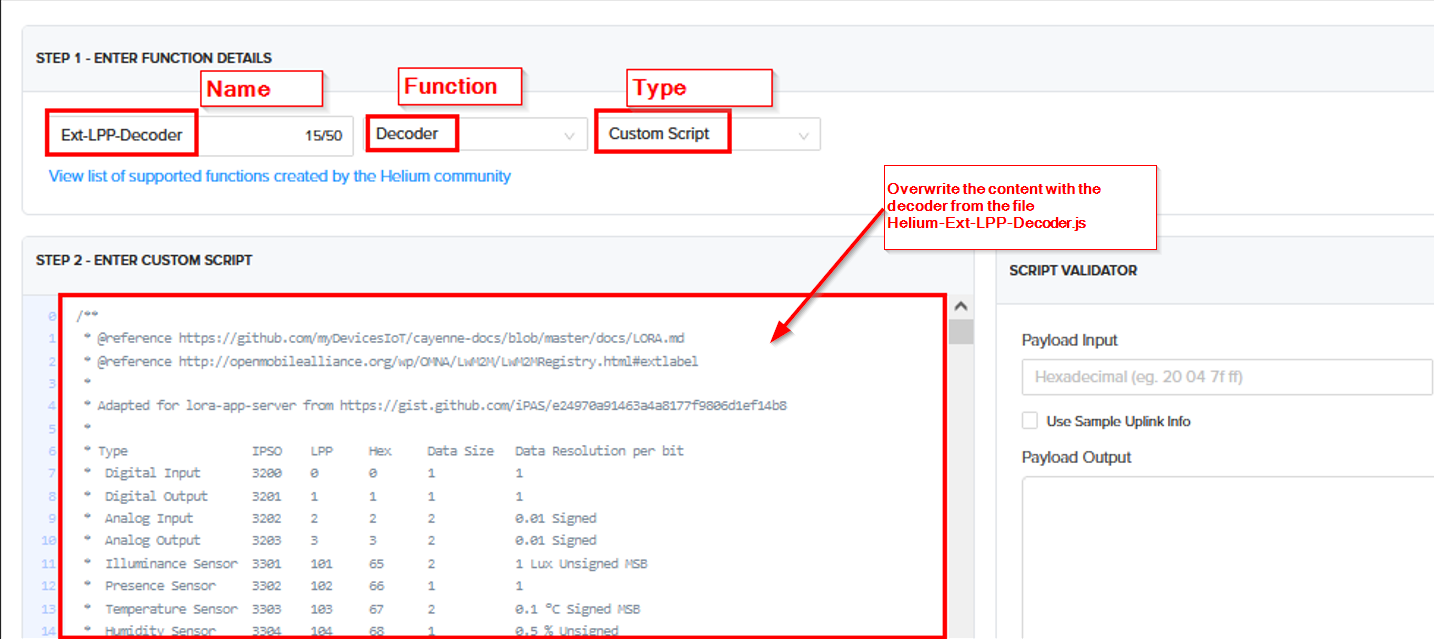
In step 1, give the function a name, I chose “Ext-Lpp-Decoder”, select the function “Decoder” and then the type “Custom Script”. After that the window will extend and you will see an example decoder function.
In this second step, overwrite this example with the javascript from the file Helium-Ext-LPP-Decoder.js
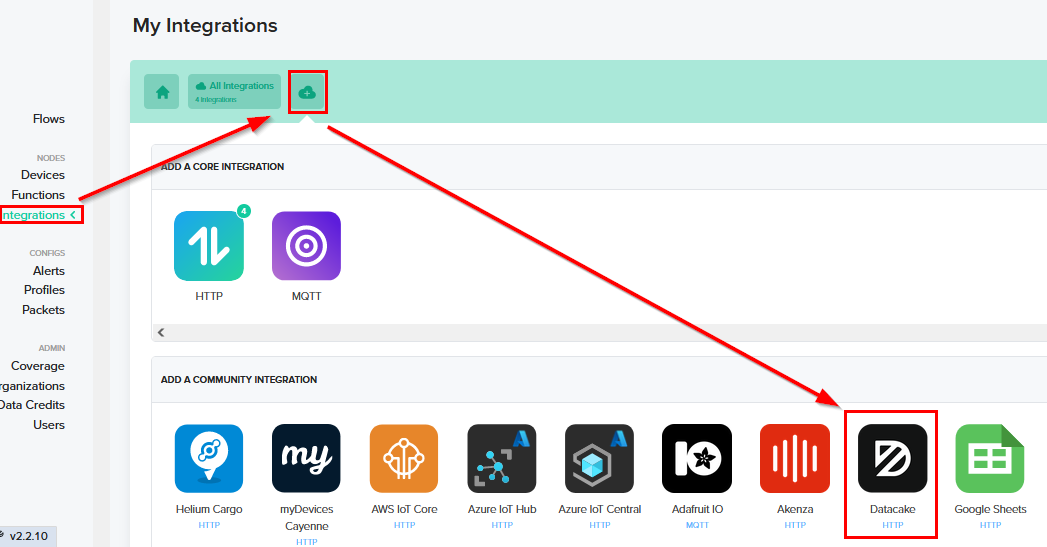
To send the data from the Helium Console to Datacake we need to create an Integration. Go to the Integrations tab, select Add New Integration and then select the Datacake Integration.
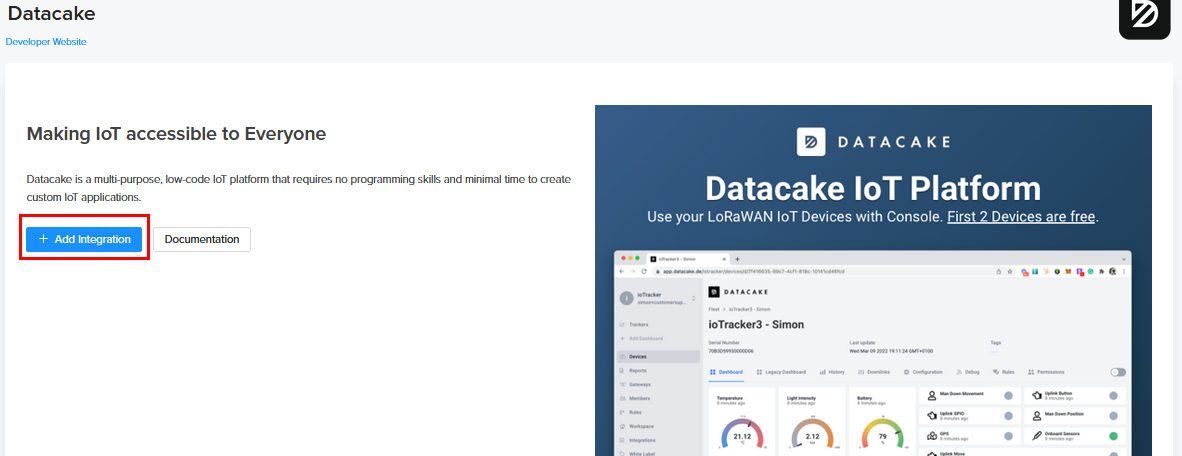
In the next window click on Add Integration
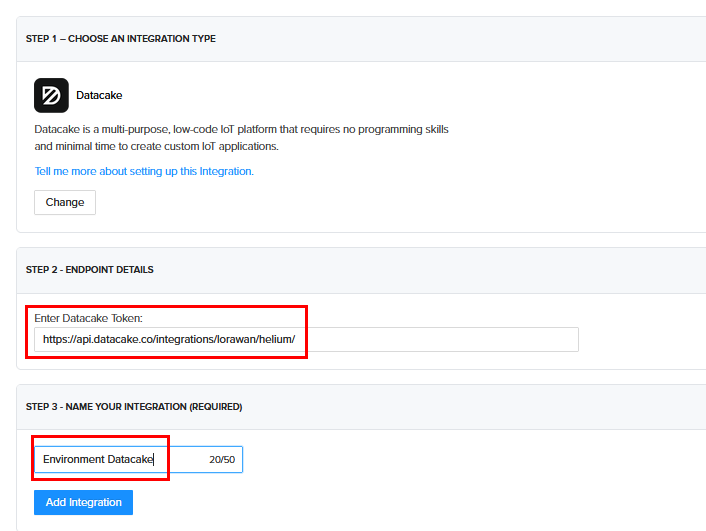
Then enter the Datacake Token (Datacake URL) and give the integration a name
That’s all on the Helium Console. The next steps are on the Datacake Console. If you do not have an Datacake account yet, you can register for free to visualize a limited number of sensor nodes.
Setup Datacake
In the Datacake Console, go to Devices and click on Add Device.
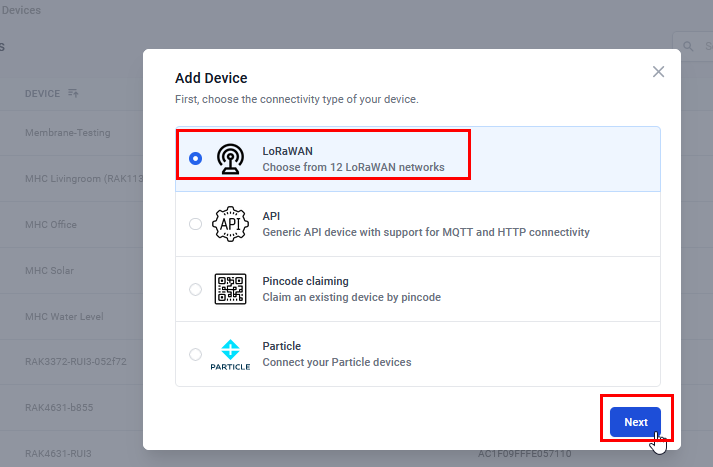
Choose LoRaWAN from the opening window and click Next
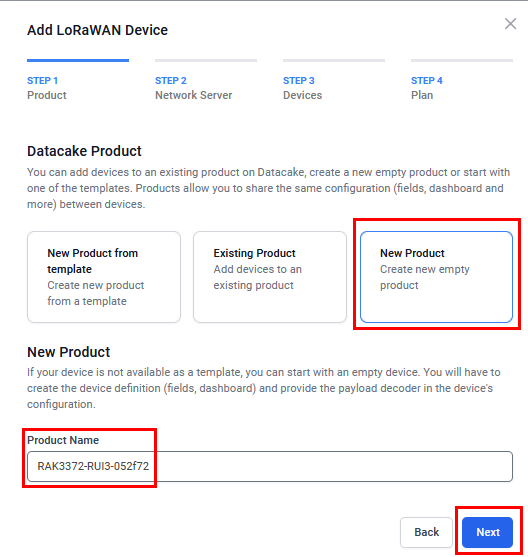
In the next window choose New Product, give it a product name and click Next
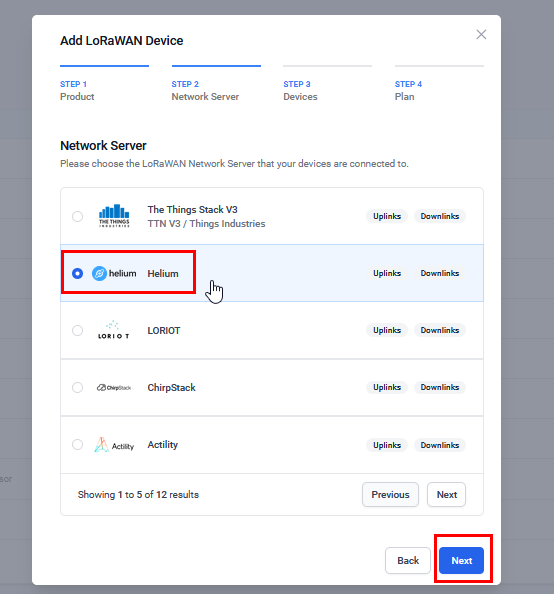
Then select Helium Network and click Next
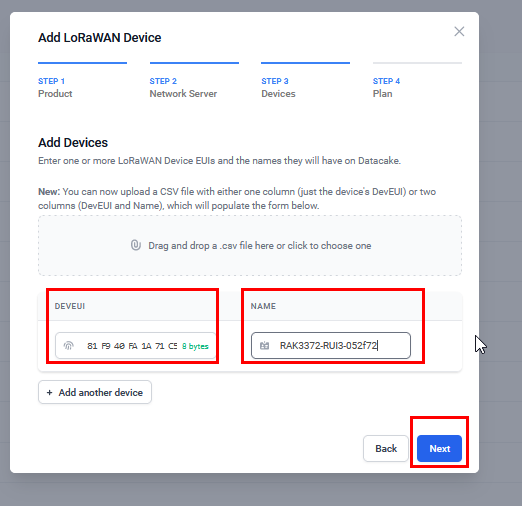
Enter the device EUI in the field DevEUI and give the device a name, then click Next
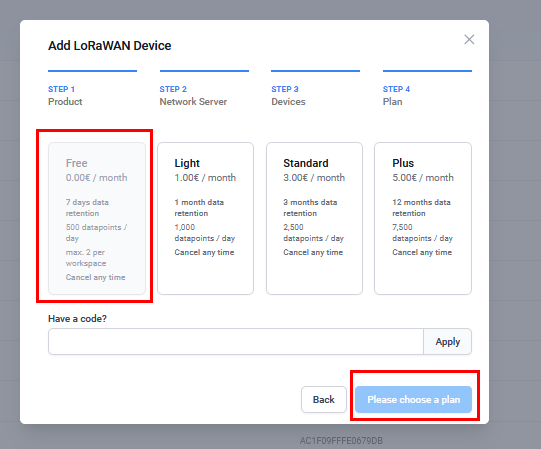
And in the last step you can select the Free plan if this is your first device on Datacake, then click on Create.
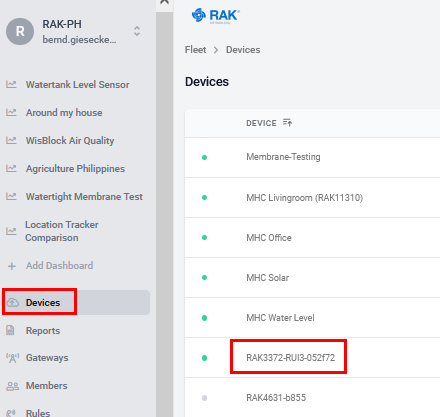
Now that you have created the device, open it from the Devices tab.
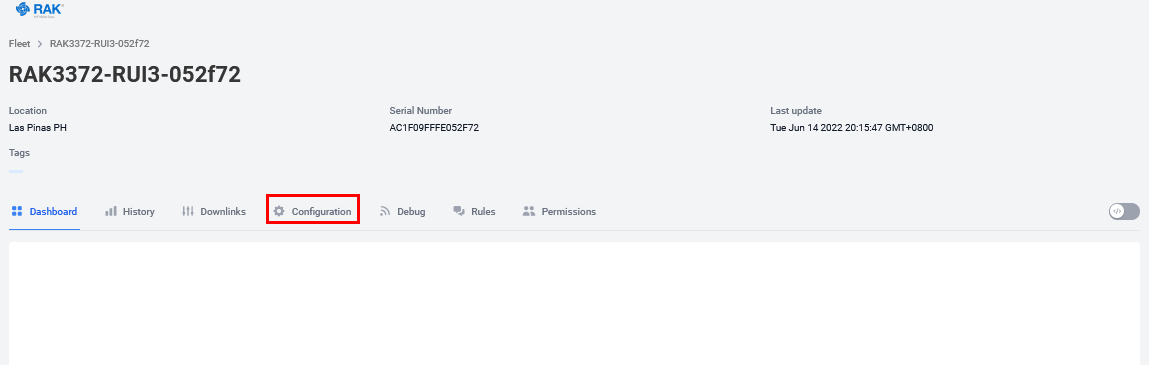
First there will be an empty dashboard, because first we need to configure the device. Click on Configuration to continue
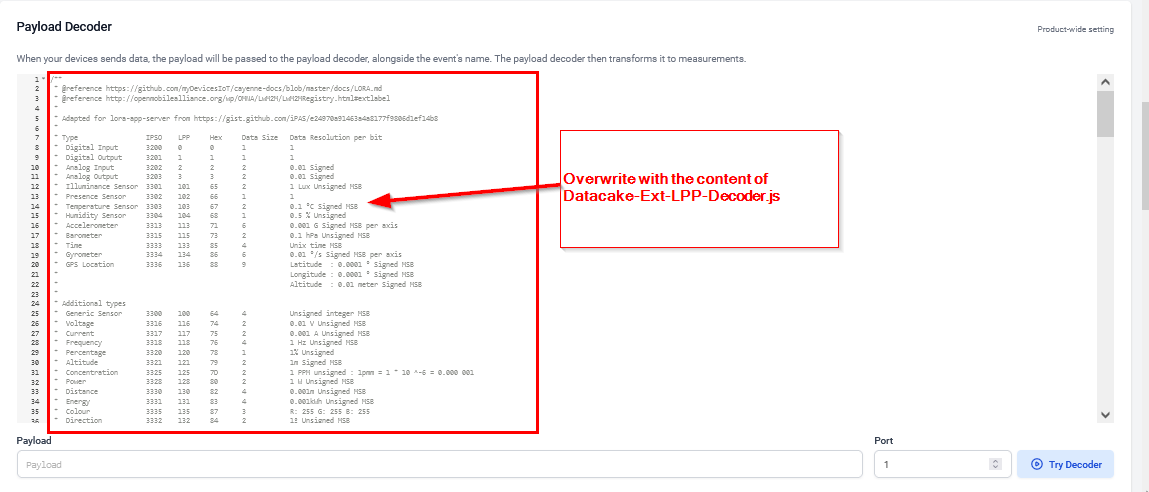
In the Configuration tab scroll down until you see the Payload Decoder. Overwrite the example decoder with the content of the file Datacake-Ext-LPP-Decoder.js. You can download the Datacake-Ext-LPP-Decoder.js from the decoders folder.
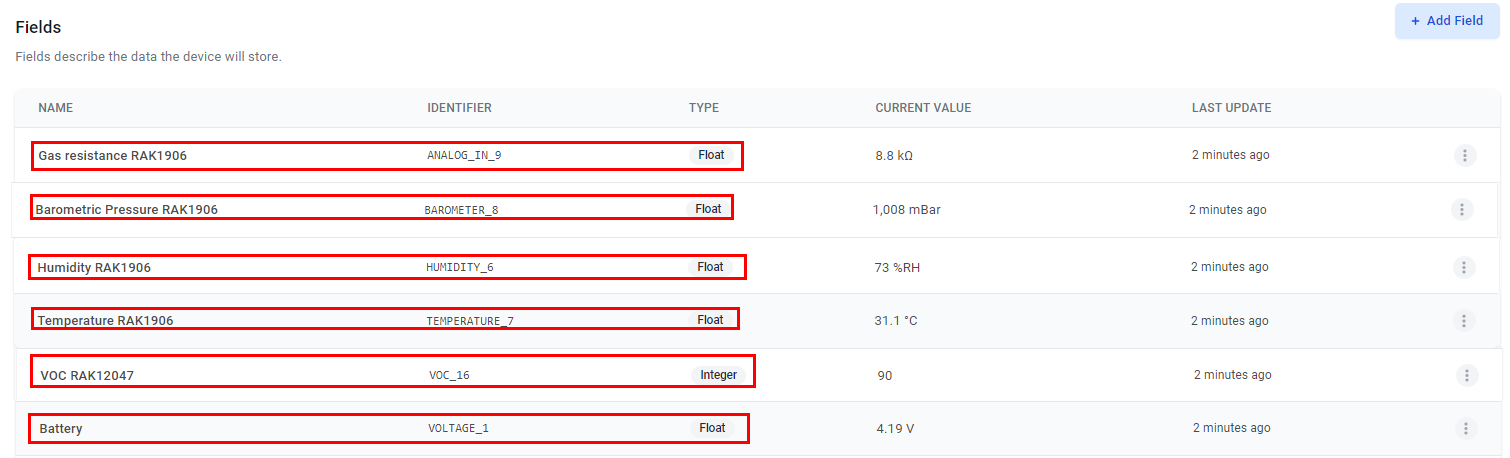
Scroll further down until you see the section Fields. Use the Add Field button to add the following data fields:
| Name | Identifier | Type |
|---|---|---|
| Gas resistance RAK1906 | ANALOG_IN_9 | Float |
| Barometric Pressure RAK1906 | BAROMETER_8 | Float |
| Humidity RAK1906 | HUMIDITY_6 | Float |
| Temperature RAK1906 | TEMPERATURE_7 | Float |
| VOC RAK12047 | VOC_16 | Integer |
| Battery | VOLTAGE_1 | Float |
Don’t forget to push the Save button for each configuration section that you updated.
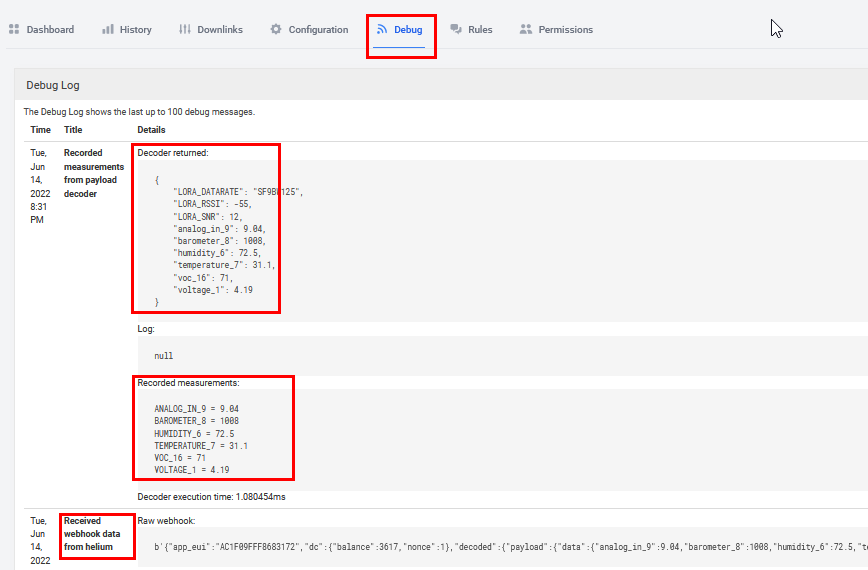
Now open the Debug tab and check if the data from the sensor is arriving and decoded correct.
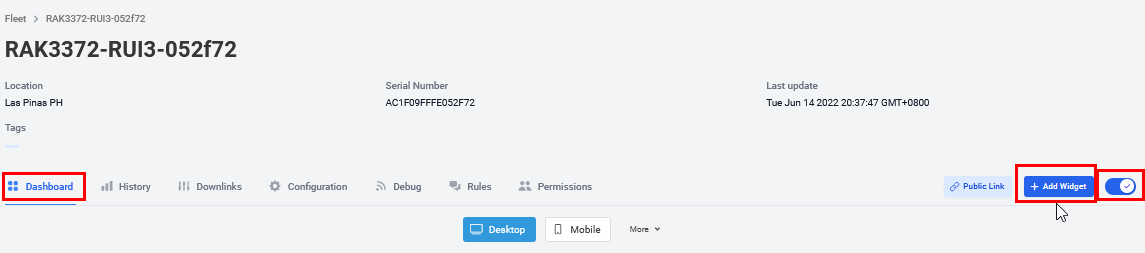
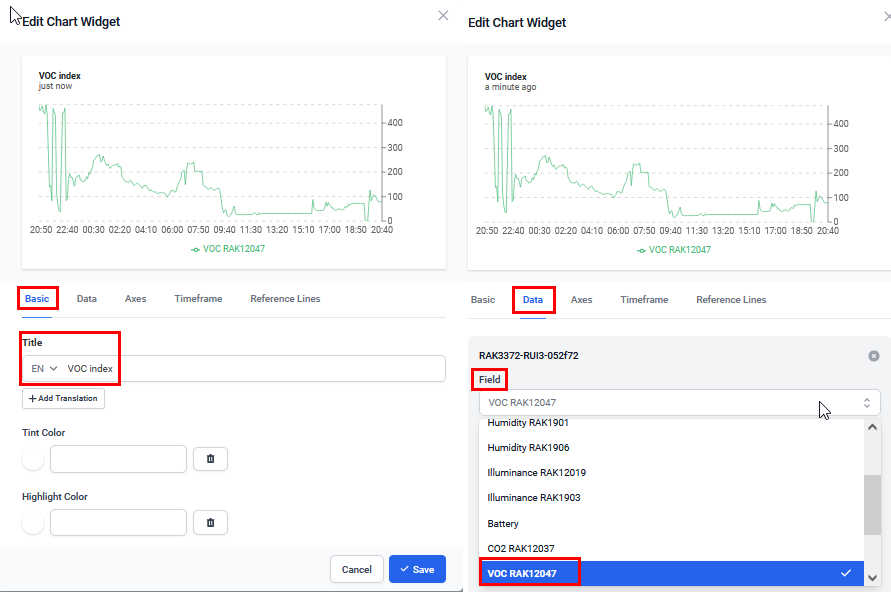
To visualize the incoming data, open the Dashboard and click on the edit icon on the right side. The setup of the visualization widgets is very simple so I am showing only the setup of the first widget.
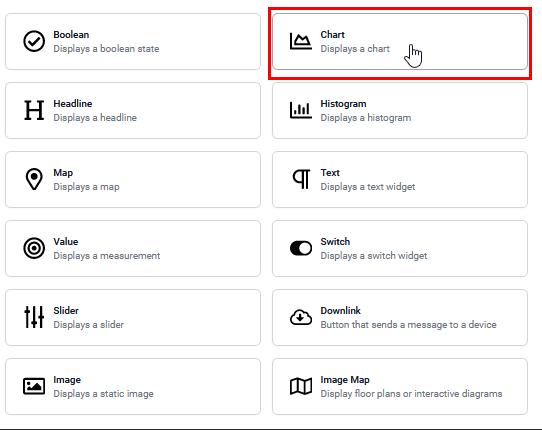
After clicking on Add Widget select Chart in the opening window
In the next window in the Basic tab you can give the widget a name and in the Data tab you select the field that you want to display
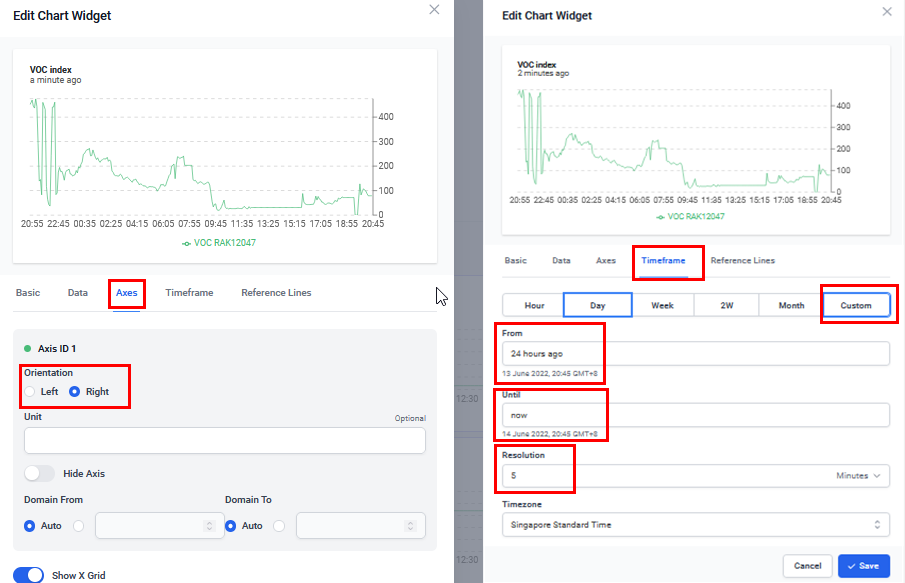
In the Axes tab you can select where the axis data is shown and in the Timeframe tab you can set the time range of the data that is displayed.
Press the Save button to finish the first widget.
I setup a couple of these widgets for the different data that is coming from the WisBlock VOC sensor node.

Push the edit icon on the right side to save your dashboard.
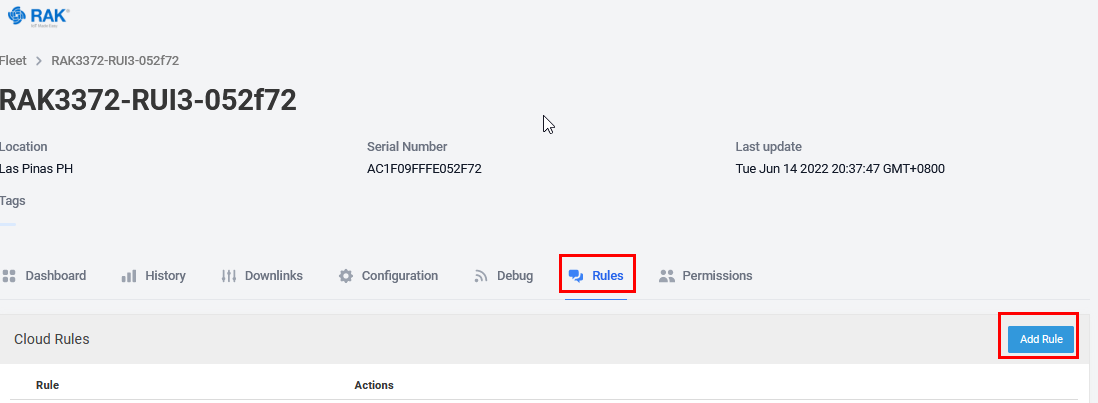
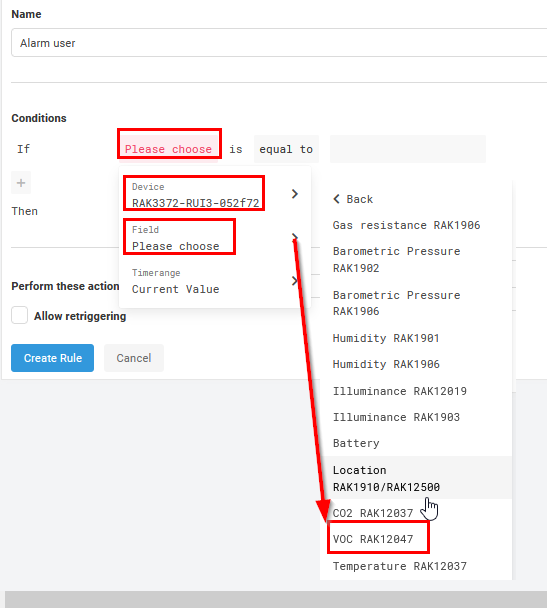
To receive notifications if the VOC index is showing bad air around the sensor we use the Rules function of Datacake. Click on Rules to see the defined rules, then click on Add Rule.
Click on Please Choose, select your device. Then click on Field and select VOC RAK12047
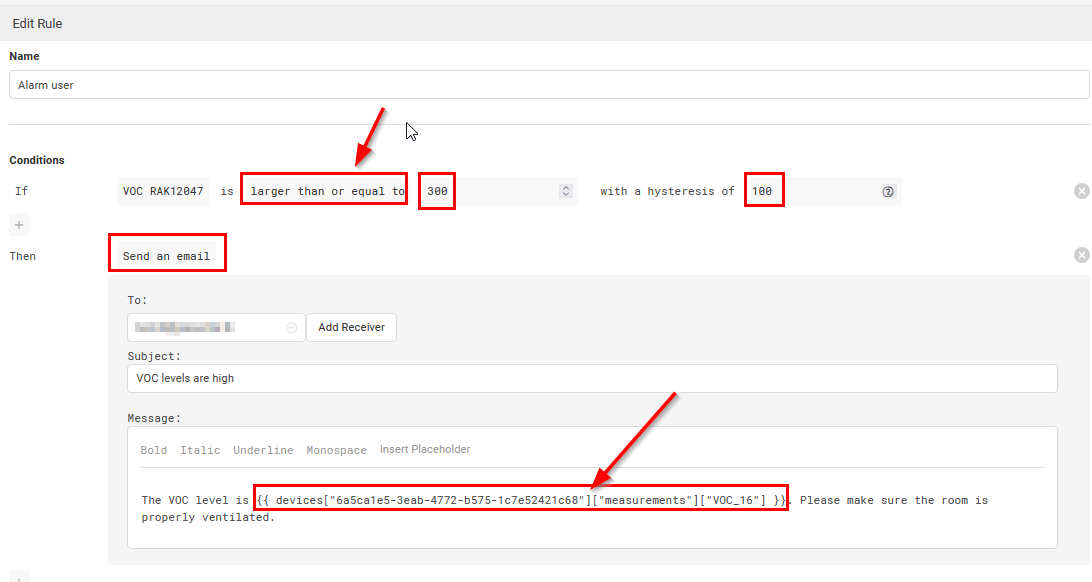
Change the criteria to “larger than or equal to”, choose the value you want the warning be sent out and set the hysteresis.
You can send the warning by Email, SMS, or initiate adownlink. I chose Email.
In the email text you can use placeholders to add the measured value of the VOC sensor.
Now everything is ready and you will be informed if it is time to open the windows and get some fresh air.
I hope you enjoyed this tutorial.
Oh, I just got an email that tells me to get some fresh air!