Signal Mapping in a Building: A LoRaWAN Experiment

When deciding on a gateway for your project, understanding the environment in which this gateway will be placed is crucial. No matter the setting, indoor or outdoor, there are factors, external to the device, that affect its performance. For a solution that will be inside of a building, the building’s specifications are going to be of utmost importance for the optimization of that solution. There is a simple method that will give you the needed data to plan and prepare your optimal deployment – signal mapping. Keep reading for the “why” and “how” and get some insight into planning your next indoor IoT project.
What is building signal mapping and why is it important?
The concept is neither new nor unfamiliar but its importance is certain.
Knowing the environment is crucial in every deployment as it will help you determine the number of gateways needed and their optimal placement to give full coverage for your project.
In order to evaluate how the RF signal propagates throughout the building infrastructure, a series of control point measurements need to be carried out. By generating sufficiently large sample set of data points for the transmitting device, where the receiving device is kept static one can draw conclusions on how the building itself affects signal propagation. Thus, it is possible to predict how well of a reception of the signal we would have for different deployment scenarios.
This information will help in planning the network and positioning the gateway/s.
What to have in mind?
Talking about buildings there are many things you need to consider.
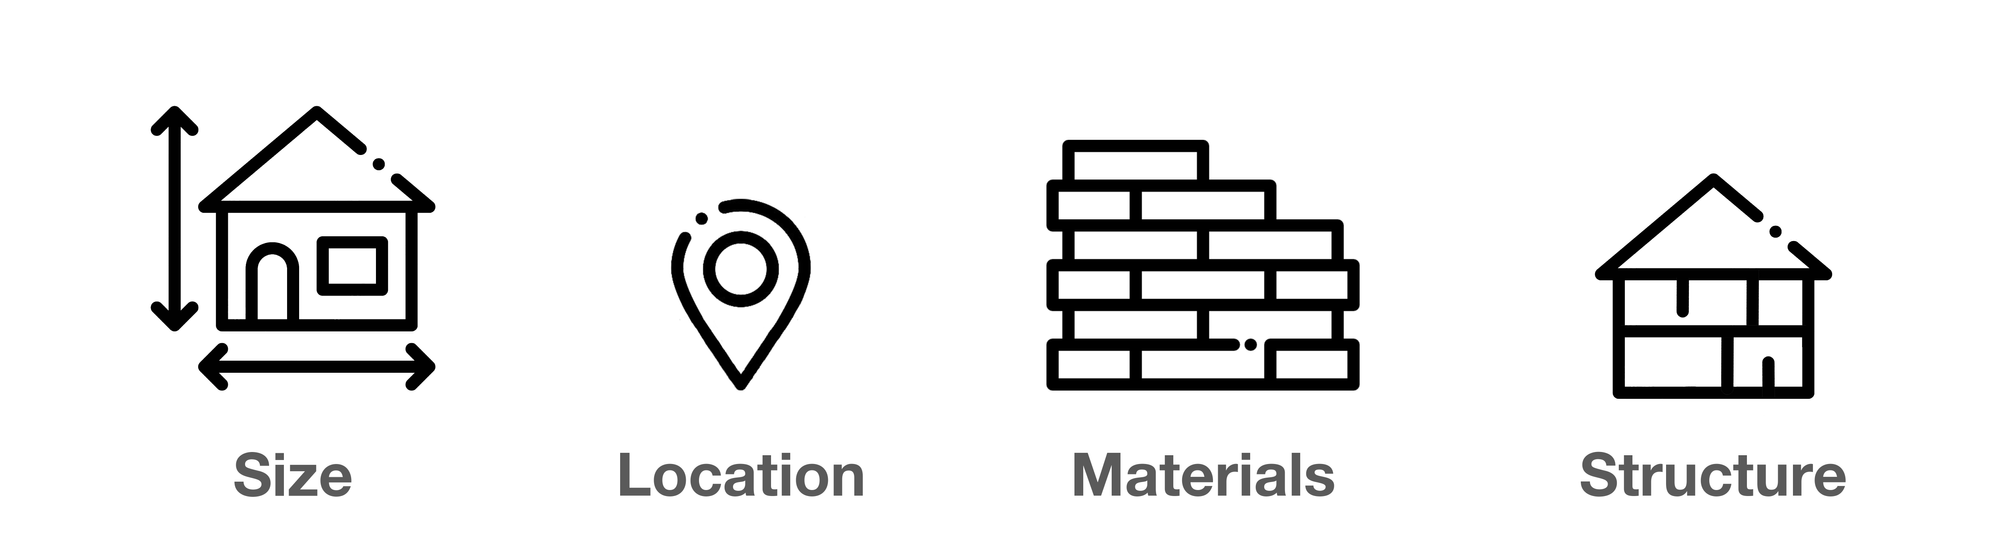
Signal propagation in buildings is not affected by natural phenomena like snow, rain, fog, etc., but due to the diversity of buildings, their size, structure, location, and different types of construction materials, it can have a widely varying level depending on the particular scenario.
Because of all those factors and obstacles, the signal can’t be really “straight”. This results in a significantly more complex multi-path structure of signal distribution to be created than that of one in the open fields.
The calculations must take into account the fact that when the signal passes through the walls of buildings, it attenuates depending on the classification of the environment (area of direct visibility, urbanized area, city center) for the outdoor measurements, the type of individual buildings (brick buildings, prefabricated buildings, skyscrapers) for the indoor measurements. This will determine the correct placement of the gateway and the need for multiple ones.
In other, more I-know-what-I’m-talking-about words: the models describing the signal propagation must take into account the following features:
- There is a significant influence of geometric shapes;
- In most cases it is not possible to use simple, possibly multi-path distribution models;
- Models must take into account the minimum penetration of the signal through the walls and floors of buildings.
The classification of indoor signal distribution models is:
- Deterministic models – The most used deterministic models for predicting the distribution of signal power in buildings are models based on the principle of beam optics (Ray-Optical models for short). These models approximate the electromagnetic wave with a beam propagating in the direction of its normal vector.
- Empirical models – Empirical models describe the distribution of the signal level through empirical equations created based on multiple measurements. In case the distribution of the partitions (walls, floors, furniture) is homogeneous or we do not have a database for their location and parameters, it is convenient to use the One-Slope model. This simplified model describes the propagation of the signal as a spherical wave, the level of which decreases linearly with the logarithm of the distance in a homogeneous space, causing signal losses proportional to the number and properties of the barriers.
- Semi-empirical models – In cases where the antennas of the base stations in the buildings are located in long corridors that cause a waveguide effect or in cases where there are different types of walls and rooms of different sizes, the accuracy of the model with one slope is insufficient. Then it is necessary to use more accurate semi-empirical models that take into account the specific location of the walls and floors.
- Semi-determined models – These models have emerged as a result of efforts to combine the advantages of deterministic and empirical models. They are usually based either on beam models supplemented by empirical expressions or approach the question of signal propagation by completely different means, such as the XYZ model.
- Hybrid models – Combinations of models used for complex calculations and high accuracy.
Let’s do an experiment.
The theory behind signal mapping is vast and too technical for the average IoT enthusiast, thus boring. This is why we are not focusing that much on it. Instead, we’ve conducted a field experiment to illustrate the process.
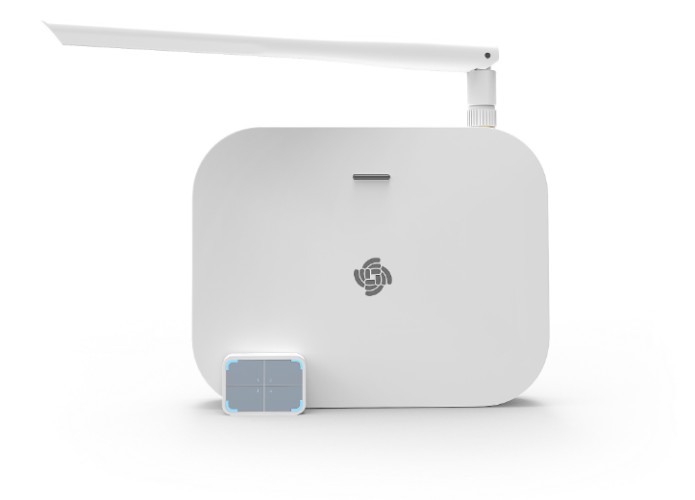
For the purpose of the tests, we are using WisGate Edge Lite 2 for our indoor gateway and the WisNode Button 4K to provide sample data.
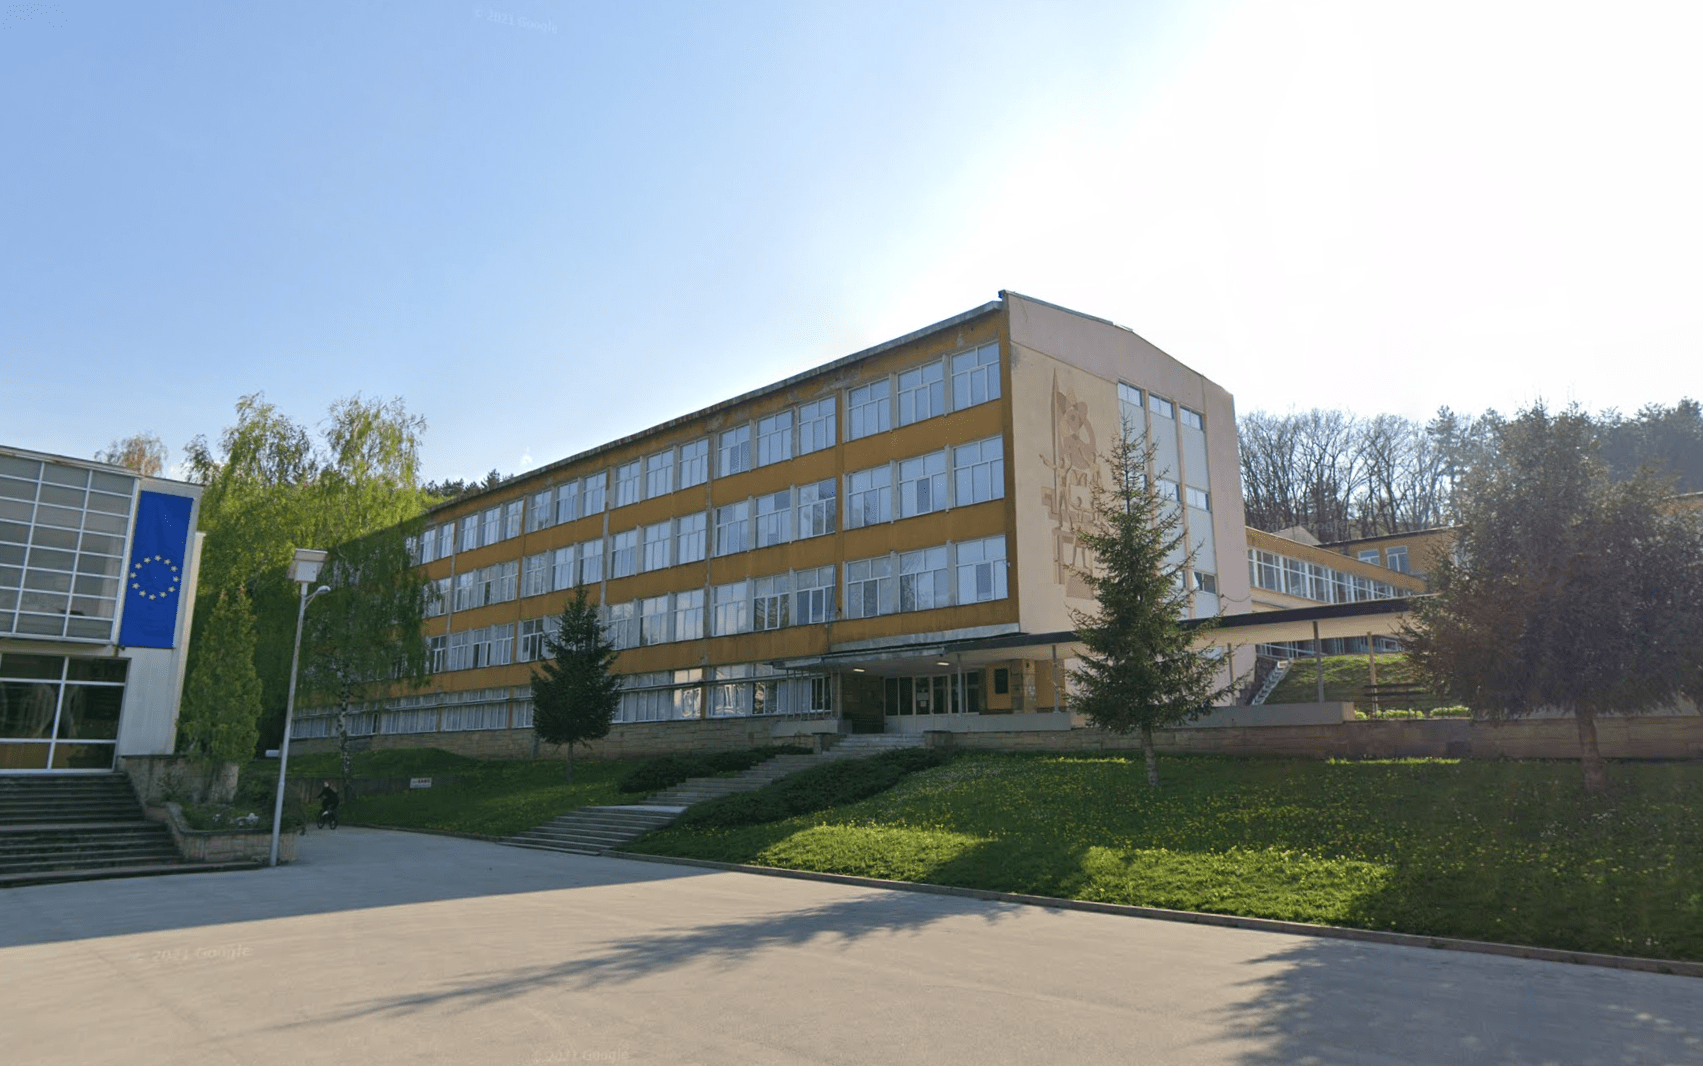
As for the building, we’ve been provided access to a massive 4 storey building with socialist construction. Meaning, it has a lot of armature fittings, thick walls made of bricks and concrete, and many rooms, all potential disruptors of the signal.
This is our building in all of its last-century glory. It is built in 1964 and it is needless to say that construction back then is far from the modern building solutions.
But this is good for our experiment. Why? Let me explain.
Today’s construction processes accommodate the new technologies both in the building itself and the potential modernization and Smart Building add-ons. The idea is that the edifices are now constructed with technology in mind, not only with the modern building techniques and materials but the possible automation and amenities inside.
But bringing old buildings into the future is also possible and without major structural changes at that. This is the real challenge, and that is why our building is the perfect example.
So, let us dive right into it, shall we?
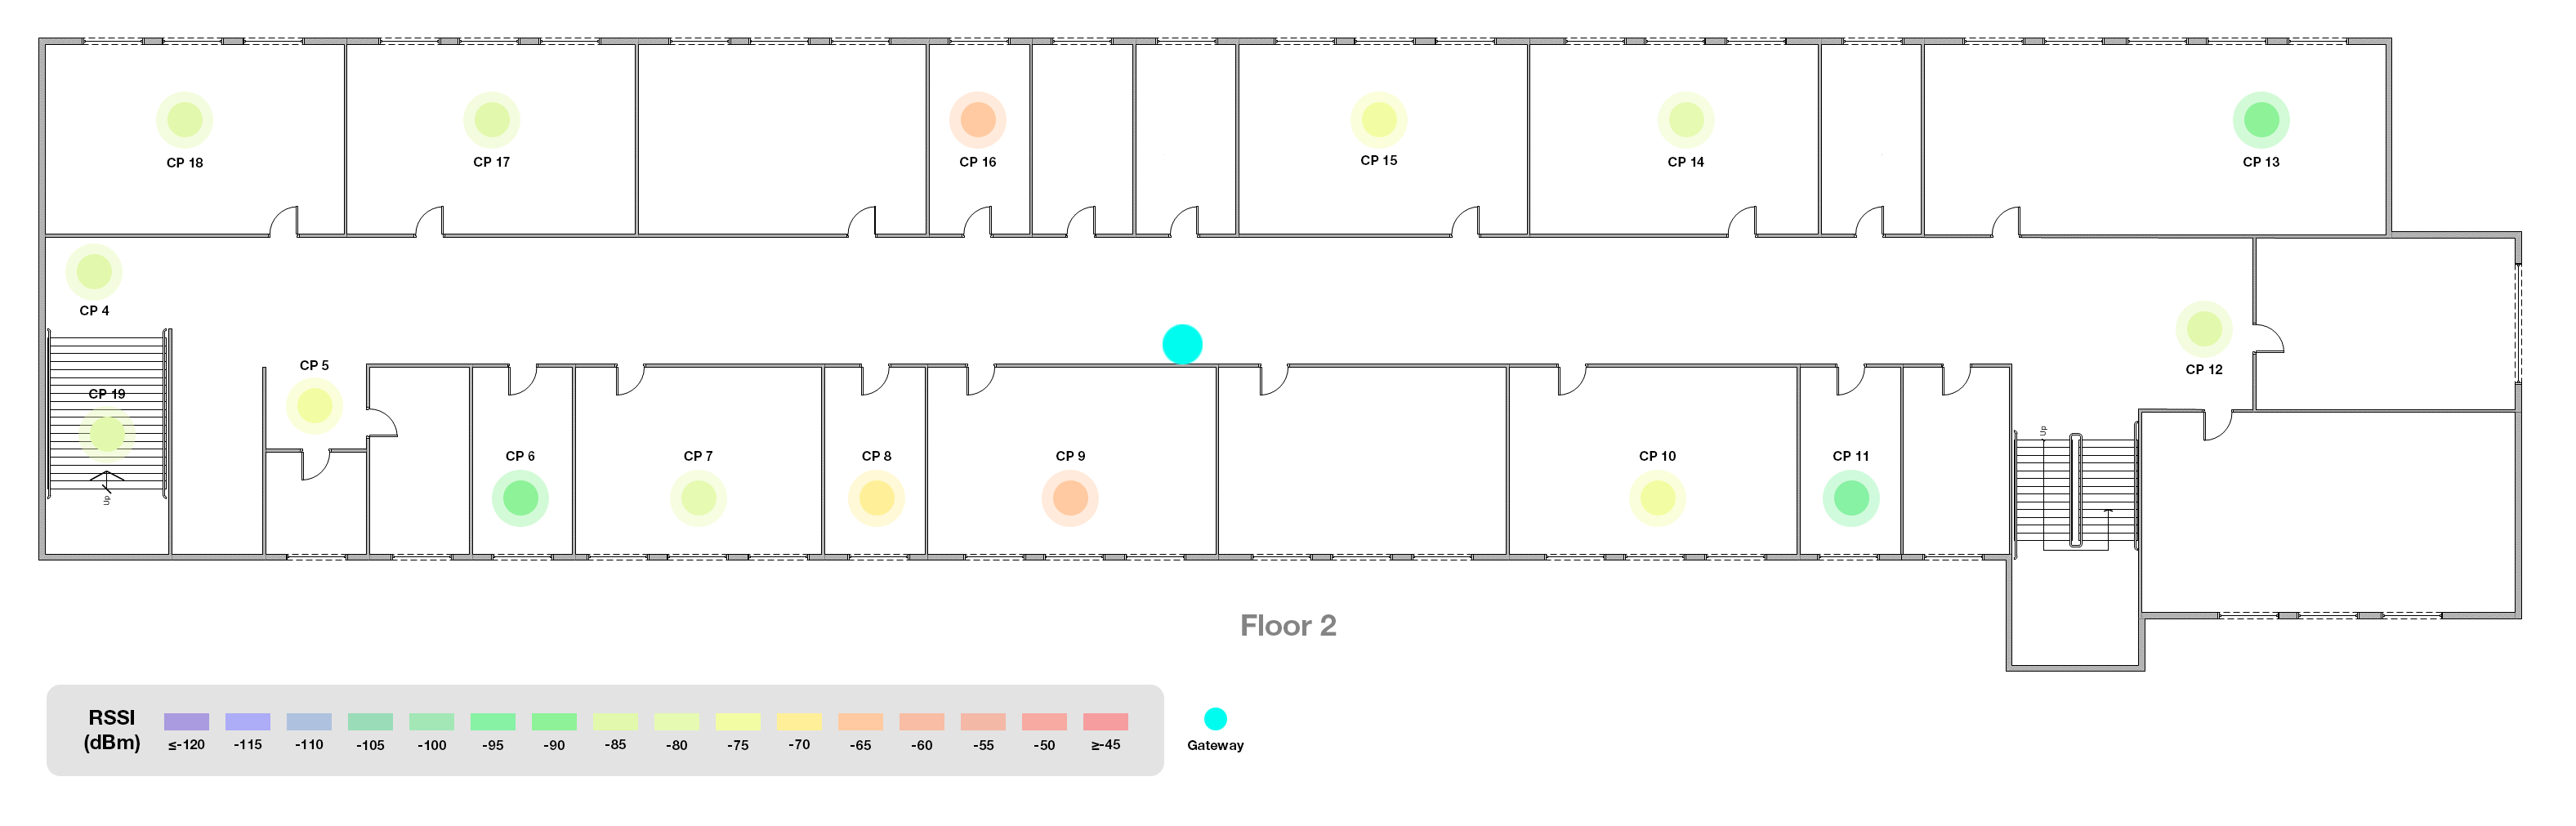
Within a building like this, with a cohesive and simple shape, the natural position of the gateway would be in the middle, and we are starting there. The WisGate Edge Lite 2 is placed in the center of the main hallway on the second floor, mounted on the upper portion of the wall, near the ceiling, with the antenna pointing up. Using the WisNode Button 4K we go around and mark some control points that will let us know signal performance around the building.
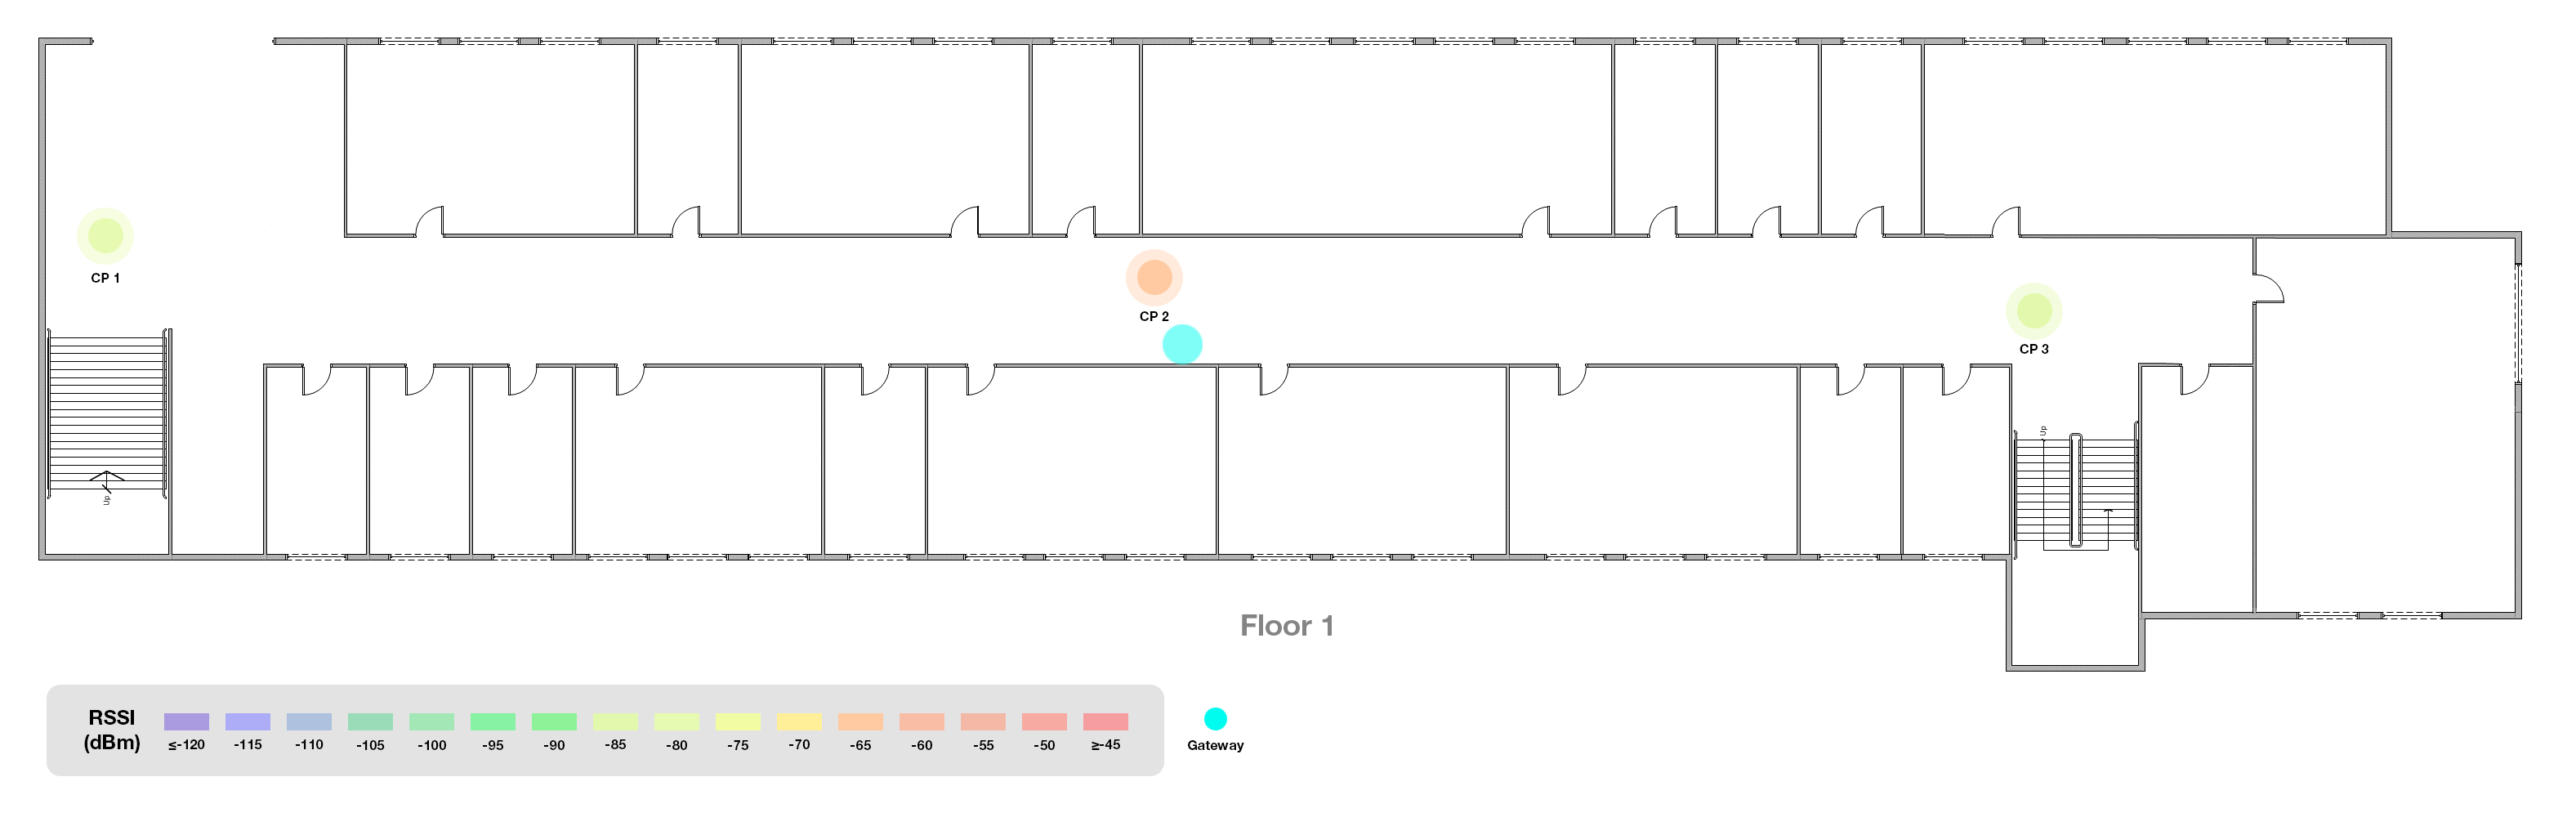
As seen below, checkpoints (CP) 1, 2, and 3 are made on the first floor while the gateway is above. Respectively, the points are at the beginning of the corridor, in the middle, and at the other end. For reference, the length of the corridor is 63 m on average, 3.5 m wide, and 3.5 m high. According to the measurements made, we have the best signal at CP 2, as it falls just below the gateway. Nothing surprising here. The surprising part is that even the two further points have a good signal, despite the thick concrete ceiling separating the node from the gateway.
Let’s move up. CPs 4, 5, 6, 7, 8, 9, 10, 11, 12, 13, 14, 15, 18, 20, 21, and 22 are on the second floor. We went a bit overboard with the CPs here, but come on! Clicking the button is fun. The gateway is also located on this floor, as we mentioned, in the middle of the corridor. On this floor, the measurements have the best performance due to the proximity of the gateway and the node. Slight disturbances of the signal are noticed in the control points 6, 11, and 13. However, these disturbances do not result in complete loss of communication.
The great results on the second floor are to be expected. Let’s see how is the situation one floor up.
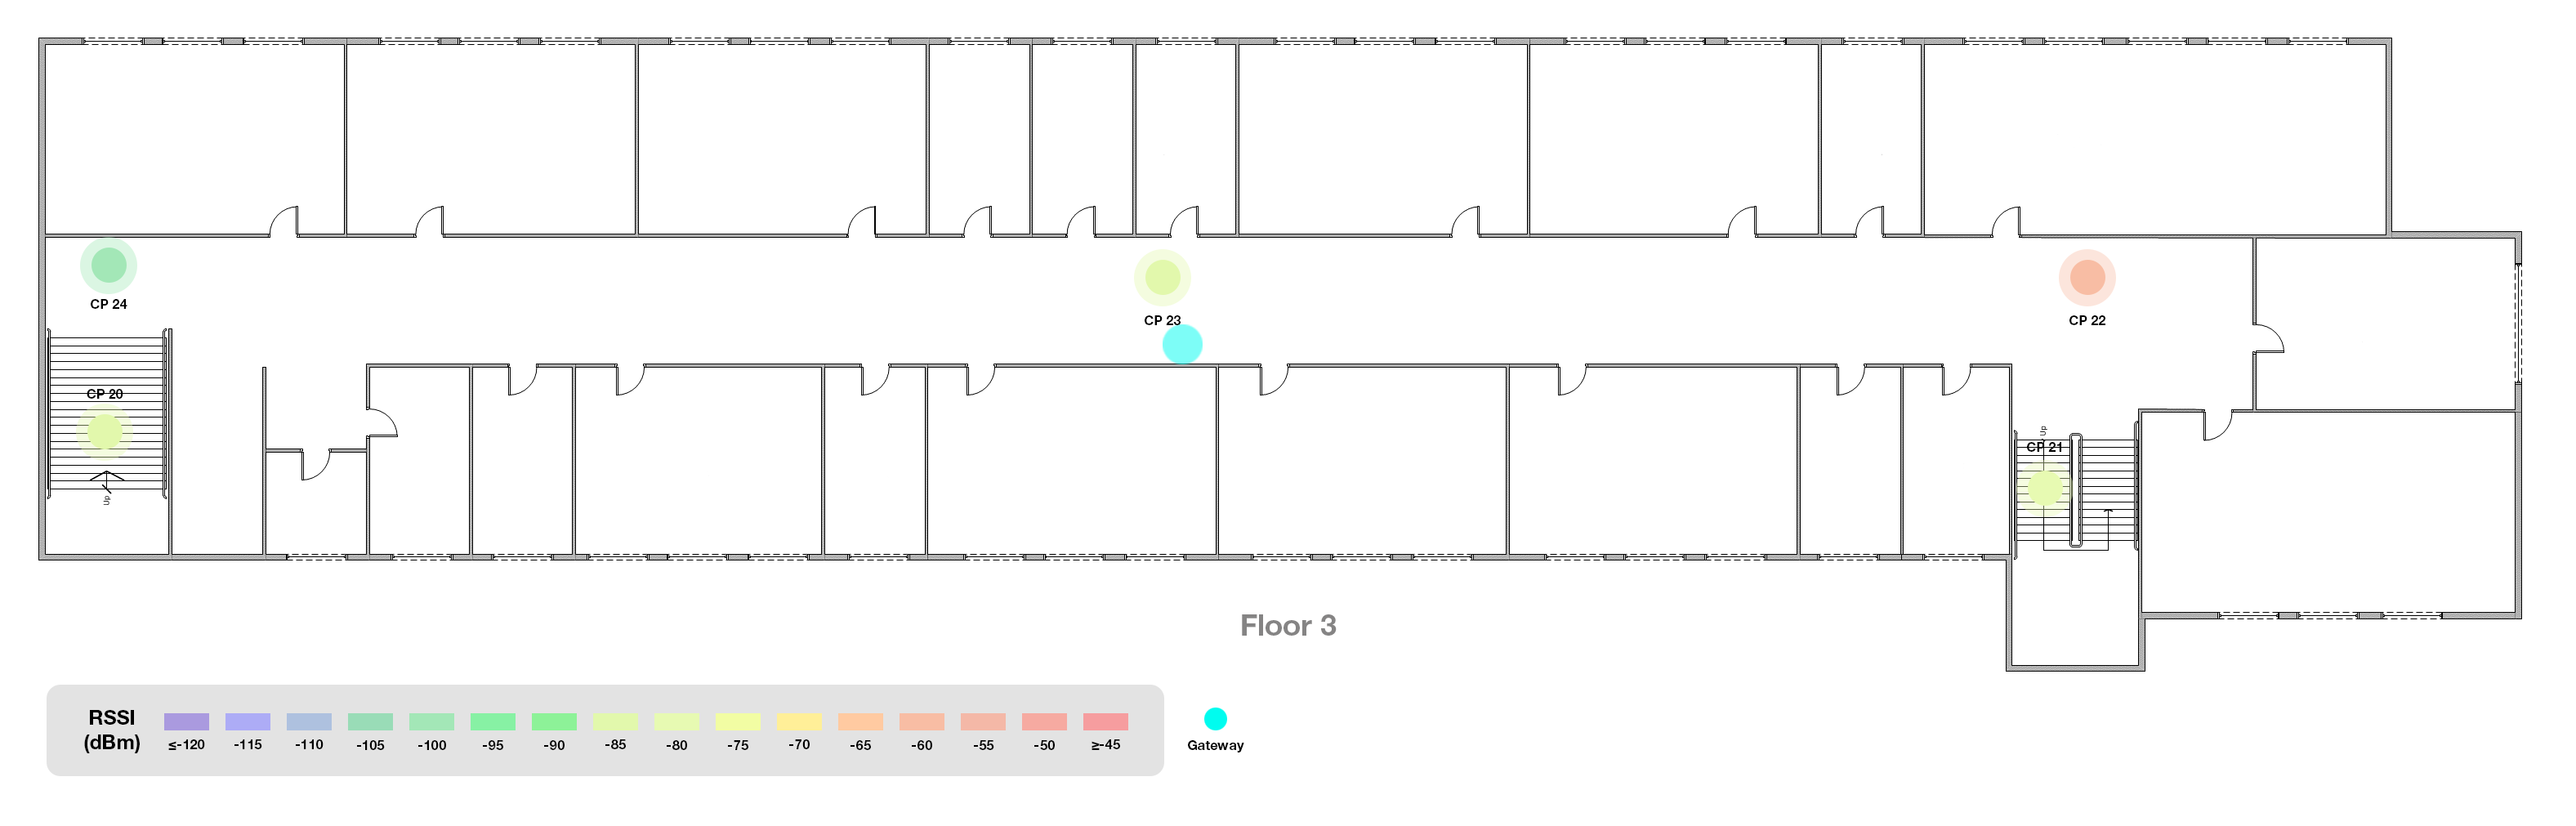
Here, on the third floor, we made CPs 23, 24, 25, 26, and 27. The gateway is still on the second floor. From the several measurements made, we can conclude that the best signal quality we are getting right above the gateway, i.e. in CP 25. However, that doesn’t mean that the signal is bad. There is no complete loss of the signal at any of the CPs.
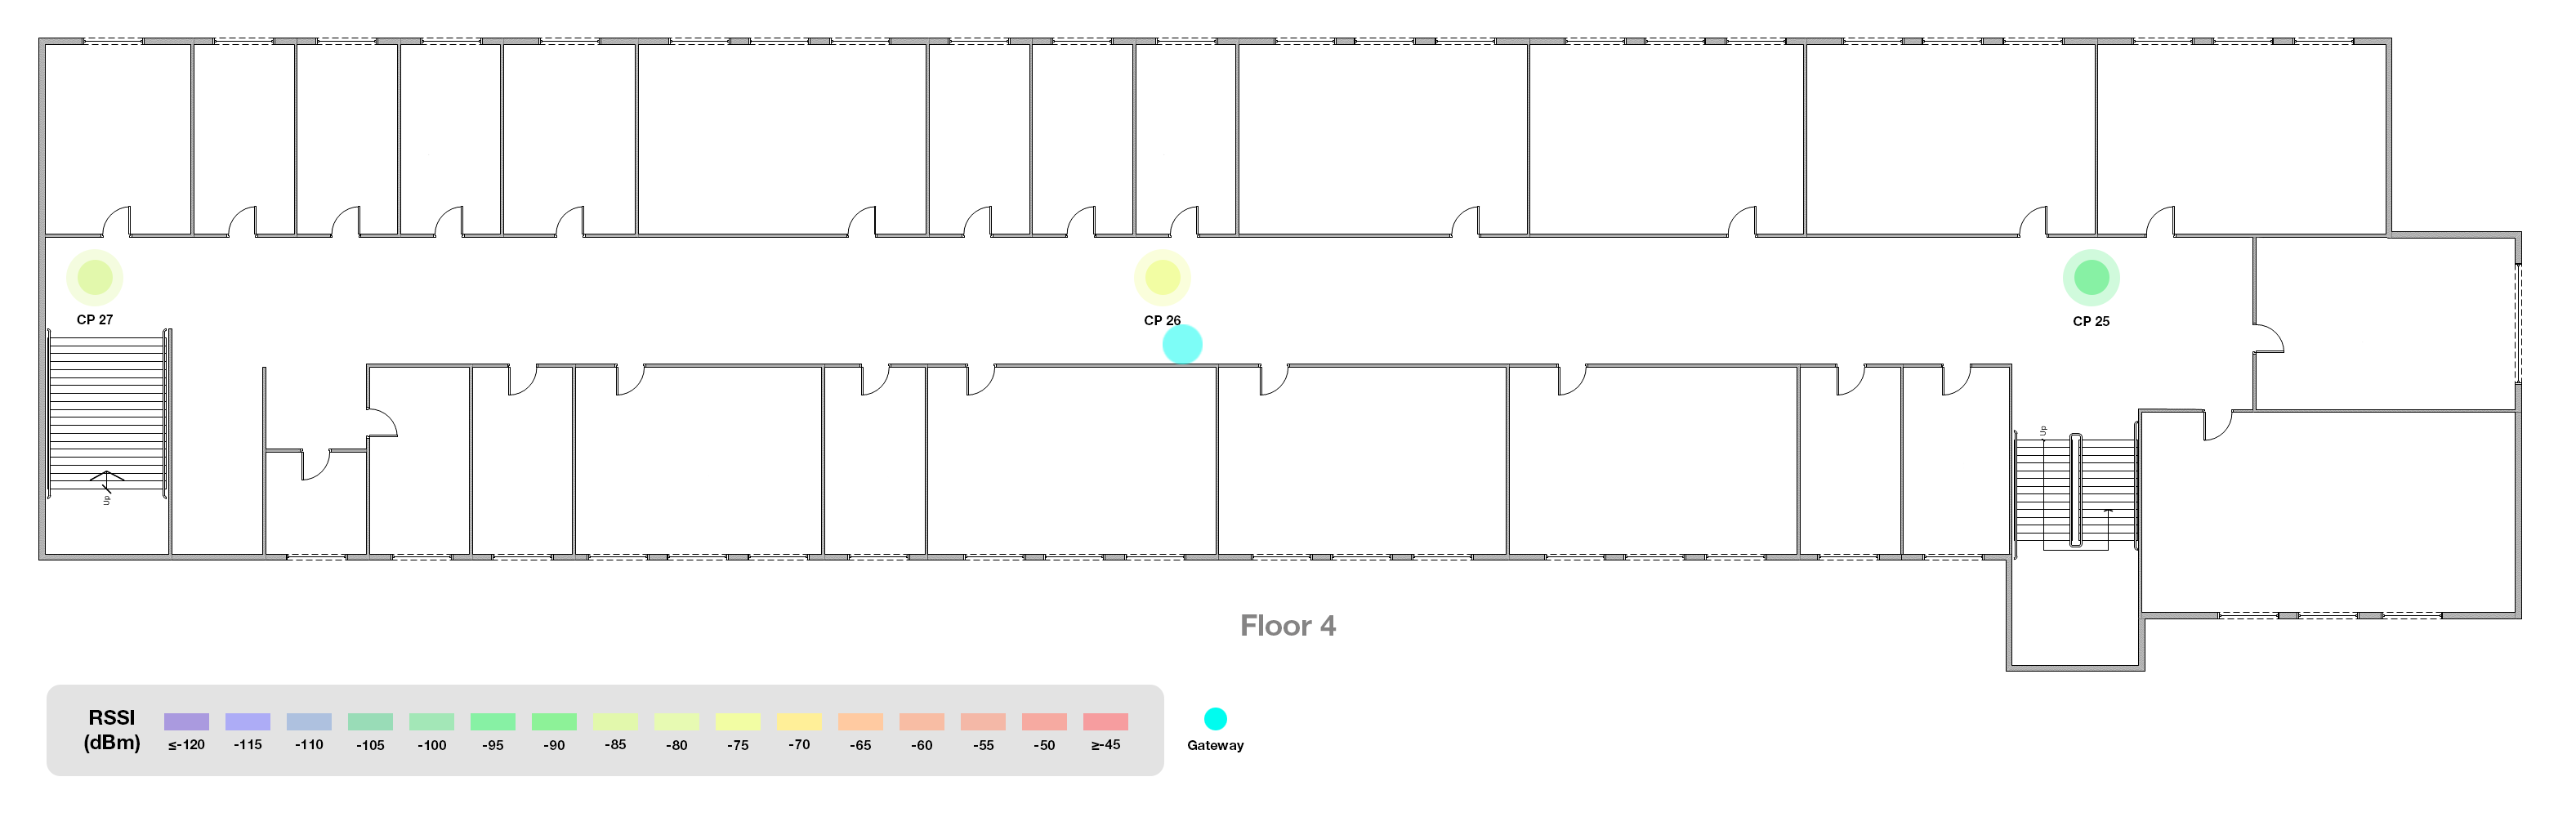
Leaving the gateway in the middle of the second floor, we are going on the fourth to do checkpoints 28, 29, and 30. The best results are received at checkpoint 29, which is again, right above the gateway. No surprises. Right below or right above the gateway, the obstacles between it and the node are the least, thus the best signal.
In a building with a somewhat unified and straight shape, like our socialist parallelepiped here, the amount of concrete, fittings, and other potential disturbers of the signal are evenly distributed in the space.
From the measurements illustrated so far, it can be concluded that the optimal location of the gateway indoors is in the center of the building. This is evident by the measurements taken on all floors. As you saw, right above and below of the gateway at the first, third, and forts floors the signal was best because of the least amount of vertical obstacles. On the other hand, on the second floor, the measurements were the best because of the least horizontal disturbances.
For comparison, we tried positioning the gateway differently as well.
First case: We positioned the gateway on the first floor, mounted to the wall at the southern end of the corridor. The location of the button was on the fourth floor, at the other end of the corridor (north). The length of the diagonal is about 65 meters in a straight line through the concrete slabs on each floor. The average value of RSSI is -107 dBm.
Second case: Switching things up a bit, the gateway went on the southern end of the fourth floor’s corridor and the button went down to measure the other diagonal. The length of the line is the same with slight variations in obstacles because of the small differences in room positioning on each floor. The average value of RSSI is -108 dBm.
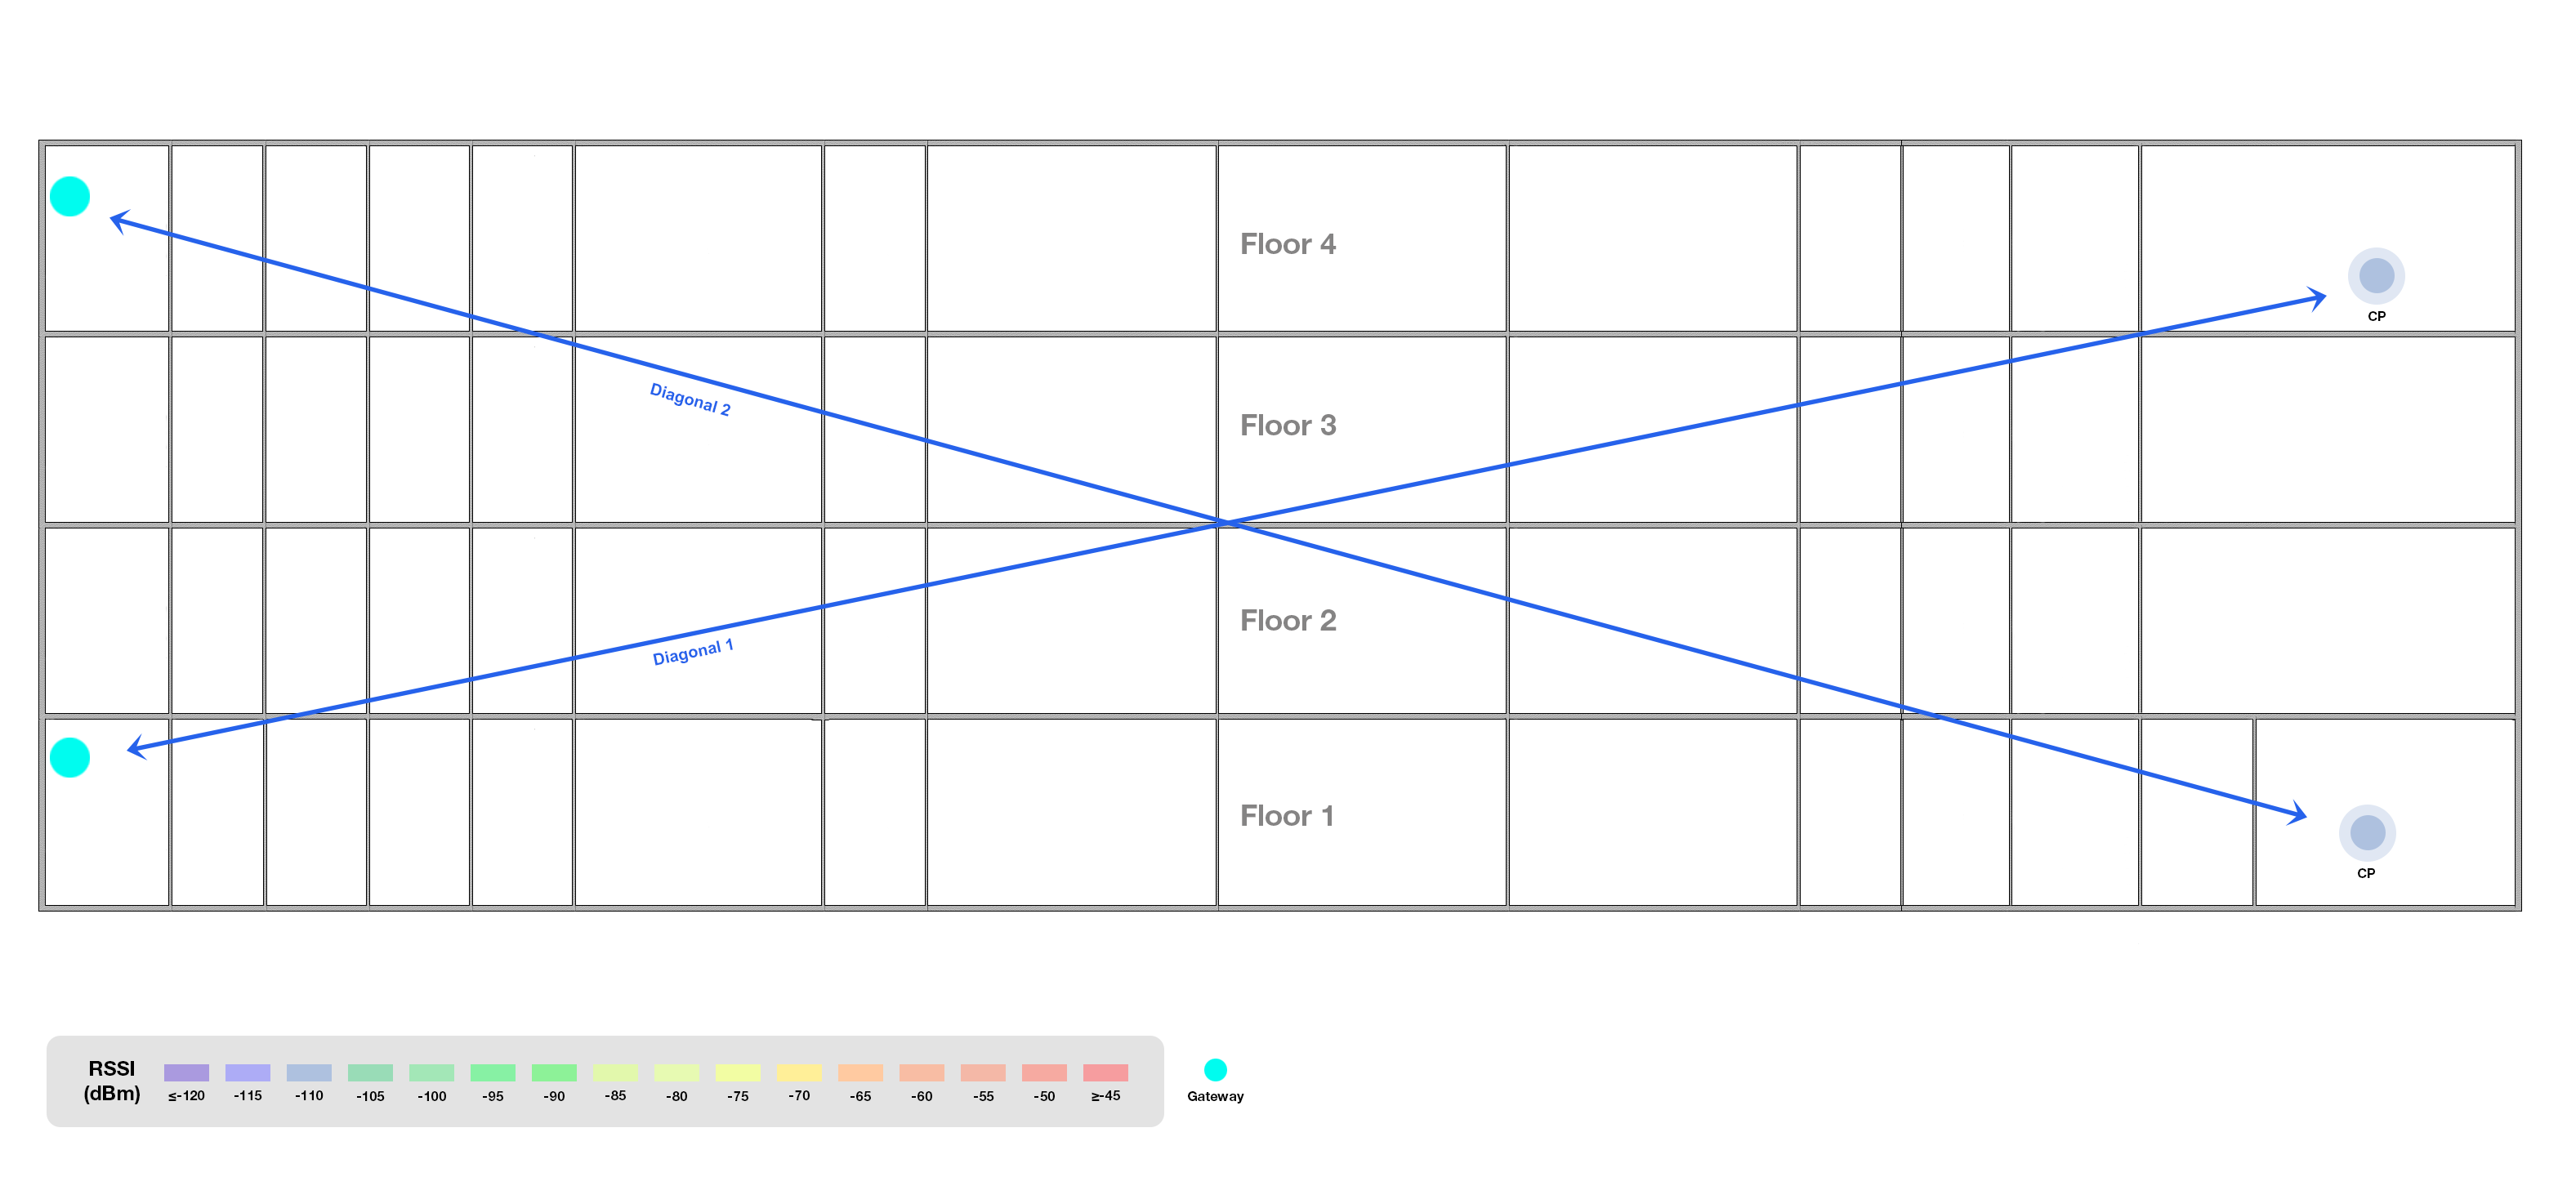
According to the measurements, the concept of the possibility of deploying LoRaWAN access points indoors, even in buildings with a lot of concrete and partition walls in which the measurements were carried out, has been successfully proven. There is hope for old buildings guys! And this is only one gateway, imagine what you can accomplish with two.
What about coverage outside the building?
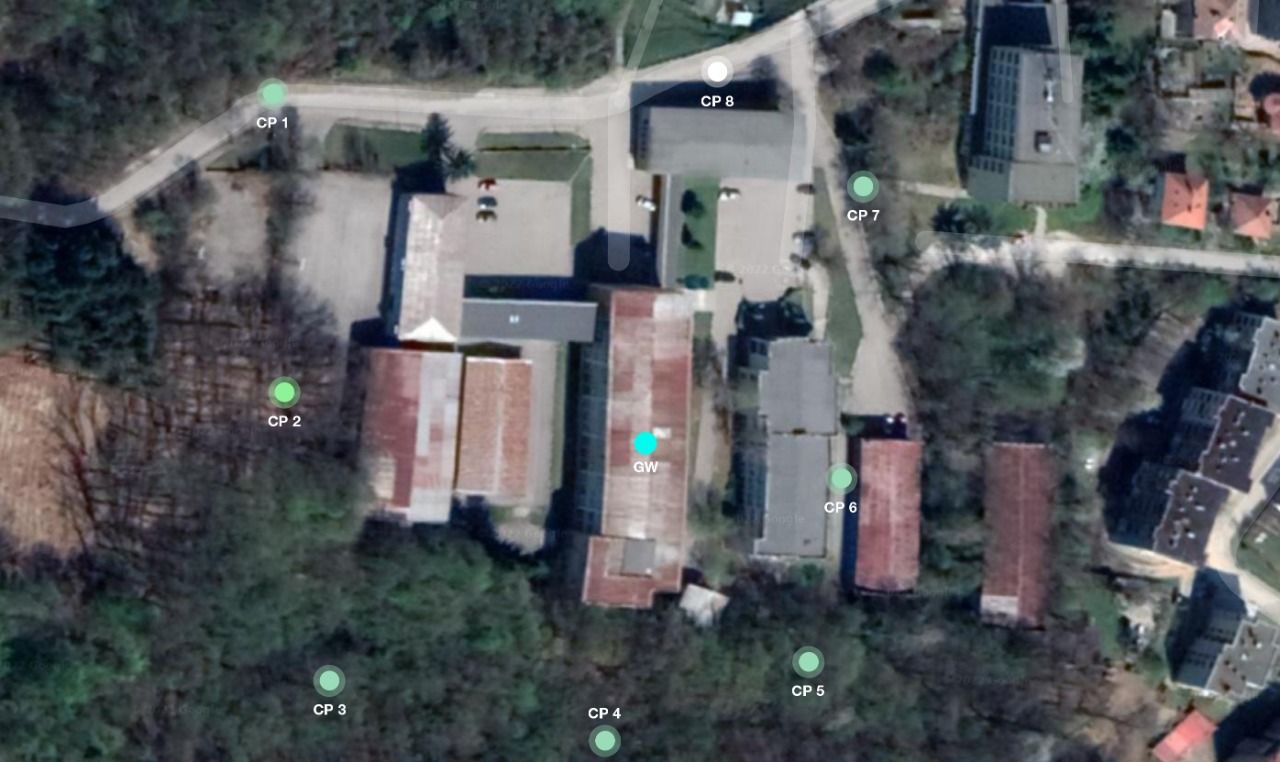
We thought about that as well. Leaving the gateway in the middle of the second floor, we made eight checkpoints outside the building. The distance from the gateway to each of the CPs is about 70 meters in a straight line. There was only one failure point at CP 8 because there is another building in direct view of the building in which the gateway is located. It absorbs a large percentage of the signal, so the signal is heavily attenuated and it is not possible to receive the message. However, the other CPs’ transitions are going thru even though they are not that strong.
You may notice that there are buildings between other CPs and the gateway as well, for example 2 and 6, but there is no significant signal loss there. Why? The answer is horizontal displacement. The west CP 2 is higher, than the gateway and the gateway is higher than the east CP 6, while CP 8 is relatively on the same level. This is another example of why location is important.
So, if you plan to have an activity that needs coverage outside such a building, better plan for an additional outdoor gateway to ensure receiving the messages.
The results.
At every CP we pressed the button a few times (10 to be exact), generating several uplinks, to gather more comprehensive data. In the table below we are showing the averaged value for the RSSI and SNR for each checkpoint.
| Positioning | Checkpoint | RSSI | SNR |
| Node on floor 1, gateway on floor 2 | 1 | -79.70 | 8.43 |
| 2 | -66.20 | 9.70 | |
| 3 | -84.80 | 8.85 | |
| Node on floor 2, gateway on floor 2 | 4 | -84.20 | 8.66 |
| 5 | -76.00 | 9.14 | |
| 6 | -90.00 | 7.92 | |
| 7 | -80.70 | 9.11 | |
| 8 | -71.70 | 9.13 | |
| 9 | -65.00 | 9.11 | |
| 10 | -76.40 | 9.52 | |
| 11 | -95.90 | 6.45 | |
| 12 | -85.40 | 7.78 | |
| 13 | -92.50 | 8.22 | |
| 14 | -79.00 | 8.93 | |
| 15 | -73.30 | 9.40 | |
| 16 | -65.50 | 9.39 | |
| 17 | -83.10 | 8.42 | |
| 18 | -82.73 | 8.58 | |
| 19 | -83.60 | 8.42 | |
| Node on floor 3, gateway on floor 2 | 20 | -85.40 | 8.50 |
| 21 | -81.20 | 8.83 | |
| 22 | -61.80 | 9.15 | |
| 23 | -85.60 | 8.66 | |
| 24 | -99.00 | 3.24 | |
| Node on floor 4, gateway on floor 2 | 25 | -94.60 | 5.35 |
| 26 | -76.50 | 8.69 | |
| 27 | -83.80 | 8.30 | |
| Node outside, gateway on floor 2 | 1 | -103.50 | -0.18 |
| 2 | -89.30 | 7.44 | |
| 3 | -102.50 | 0.88 | |
| 4 | -104.50 | -0.42 | |
| 5 | -102.10 | 1.37 | |
| 6 | -106.30 | -1.66 | |
| 7 | -103.10 | 0.26 | |
| 8 | - | - | |
| Node on floor 1 (north), gateway on floor 4 (south) diagonal | -108.10 | -3.38 | |
| Node on floor 4 (north), gateway on floor 1 (south) diagonal | -107.50 | -3.29 |
The measurement campaign was successful in validating the assumption that LoRaWAN has sufficient range to operate in a large, thickly constructed building without significant signal degradation. It has been proven that a single gateway can service the whole building area providing good coverage and signal levels. Extending the coverage to the outside in the nearby area would require an outdoor gateway as while some coverage exists it is not optimal.
As expected, the best position for the gateway is the center of the building (floor 2, middle of the corridor).
Determining the optimal position for the gateway will ensure sufficient coverage for your solution. Now you know how!