Water Meter Application LoRaWAN® Range Test Report
Objective
This report details the outcomes of a comprehensive range testing exercise conducted for a LoRaWAN network. The test scenarios, in-building and street, aim to assess the network's coverage and performance in facilitating communication between a LoRaWAN gateway and water meter nodes. These scenarios simulate real-world deployments within urban residential buildings and streets, intending to evaluate the network's capability to maintain communication over distances up to 5 km.
LoRaWAN's reputation for extended range and efficient power consumption positions it as a leading technology for IoT applications. This test targets assessing LoRaWAN's performance in urban settings, where concrete barriers and open-air urban spaces separate gateway and water meters.
The goal is to determine the communication range and reliability between the RAK7289V2 LoRaWAN gateway and Ningbo water meter nodes featuring RAK3172 modules and RAKdesigned antennas, across diverse urban landscapes.
Testing Process
The evaluation focused on RSSI and SNR measurements and packet loss rates to determine signal strength, quality, and transmission reliability. Equipment settings:
- Frequency band: AS923-4
- ADR setting: Disabled
- Data rate setting: DR0/SF12
Testing Equipment
- Gateway - RAK7289V2 WisGate Edge Pro
- Node (end device) – Ningbo water meter nodes featuring RAK3172 WisDuo LPWAN modules and RAKdesigned antennas
Testing Environment
The testing environment is categorized into two scenarios:
In-building scenario
- Location: Residential complex with concrete structures.
- Gateway deployment: Installed on the second floor inside a building.
- Water meter placement: Various locations across the complex.
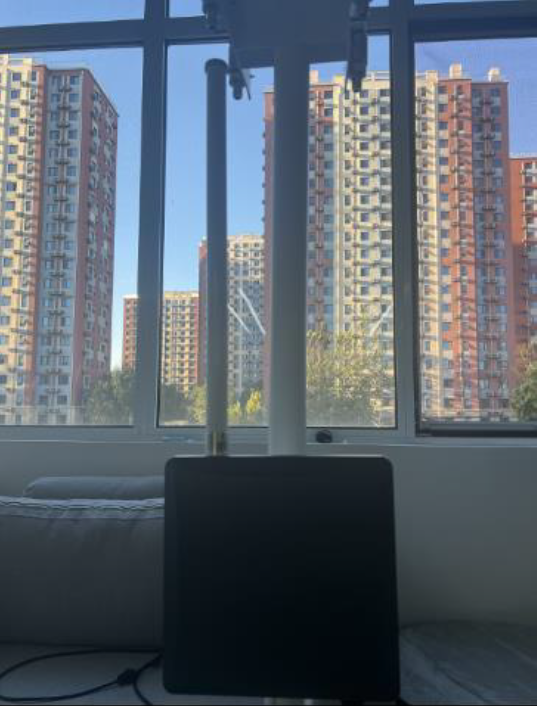
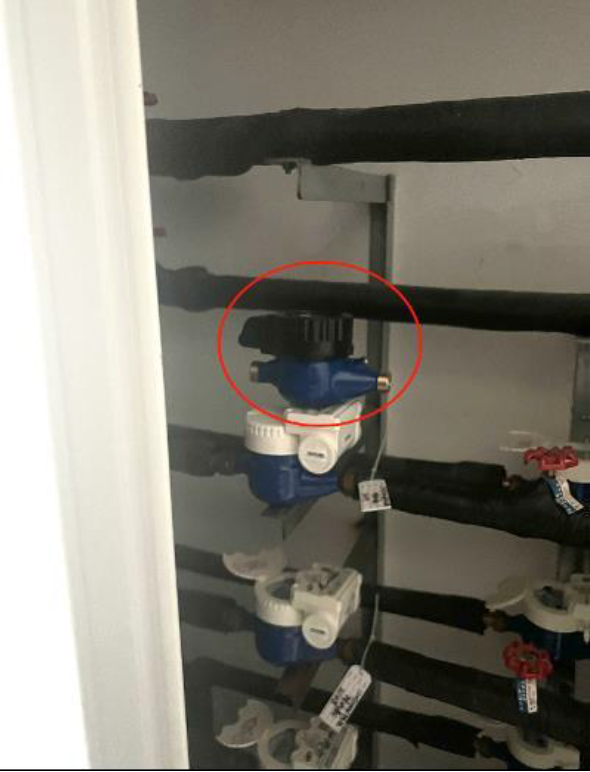
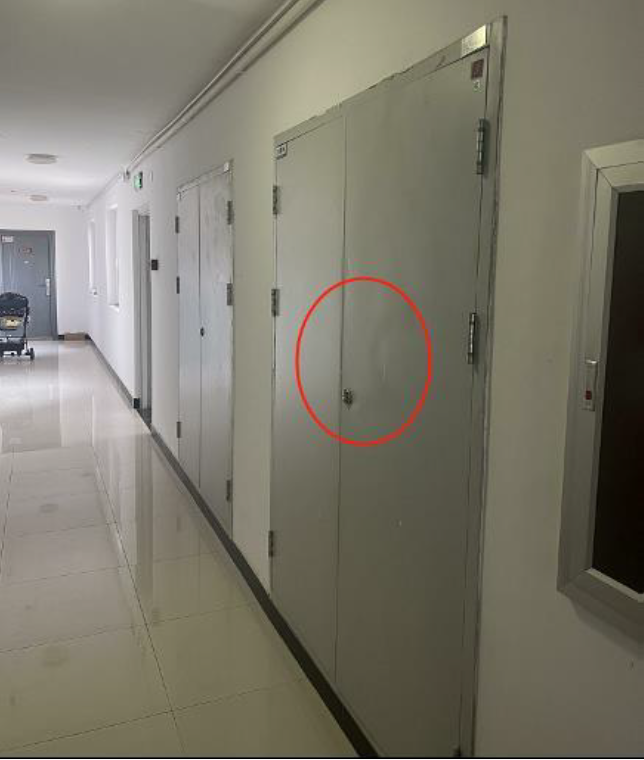
(Left): Figure 1: Gateway deployment location - (Middle) Figure 2: Water meter deployment location - (Right) Figure 3: Water meter deployed inside a cabinet
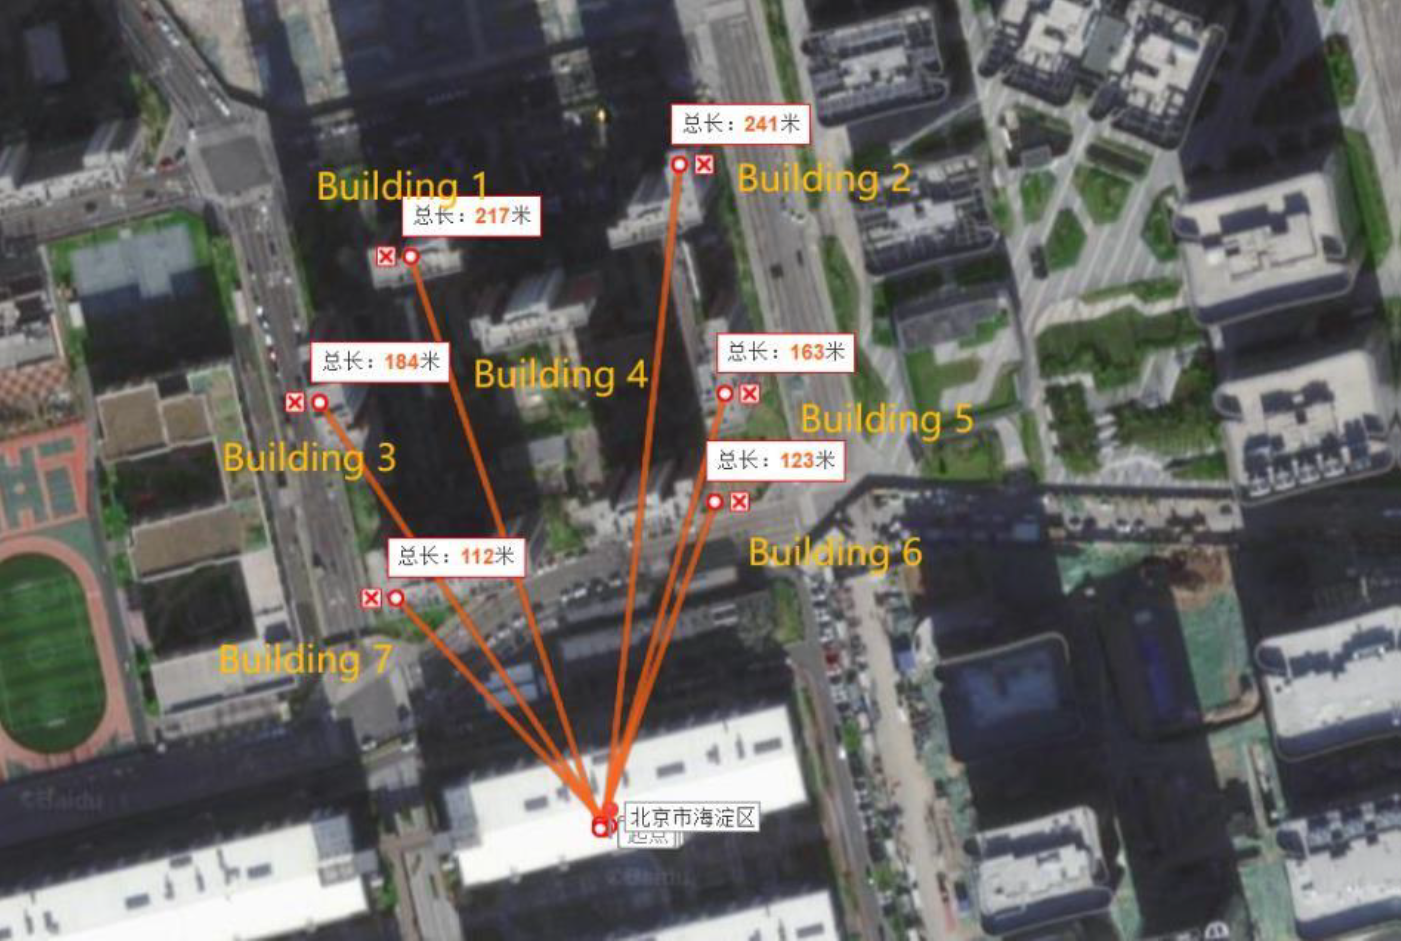
Street Scenario
- Location: City streets with the gateway on a high-rise.
- Gateway deployment: 130 meters high, on a 30-floor building.
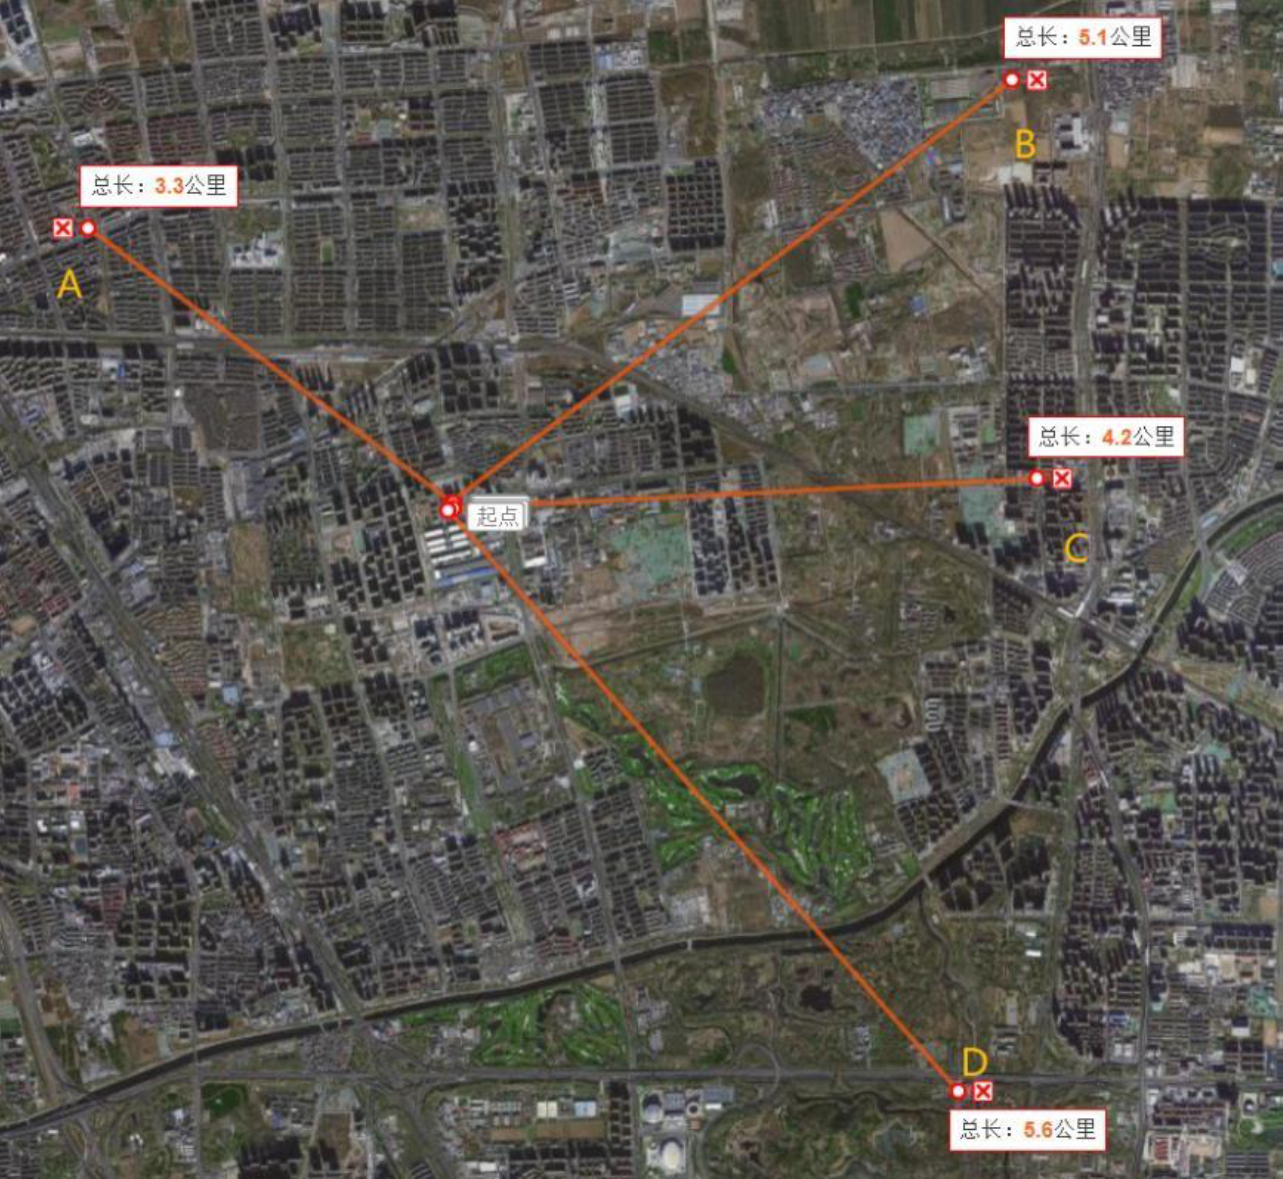
- Water meter placement: Distances of 3.3 km, 5.1 km, 4.2 km, and 5.6 km from the gateway, with two water meter samples named 001 and 002.
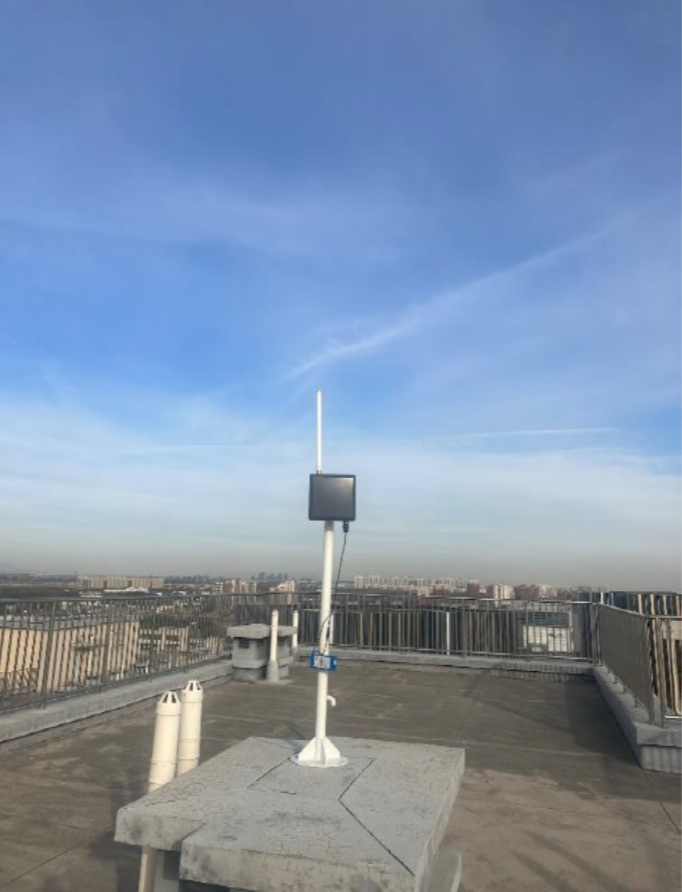
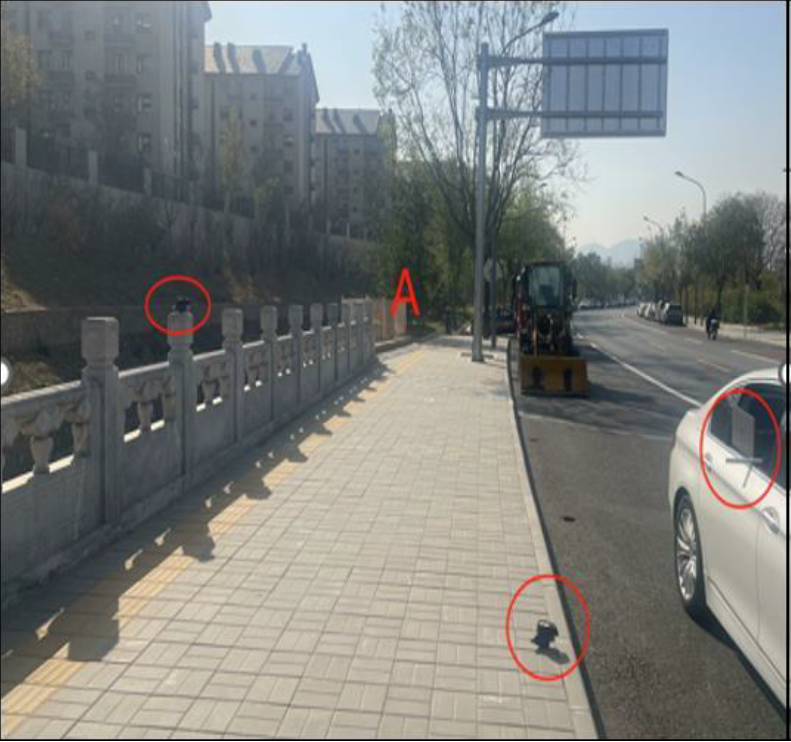
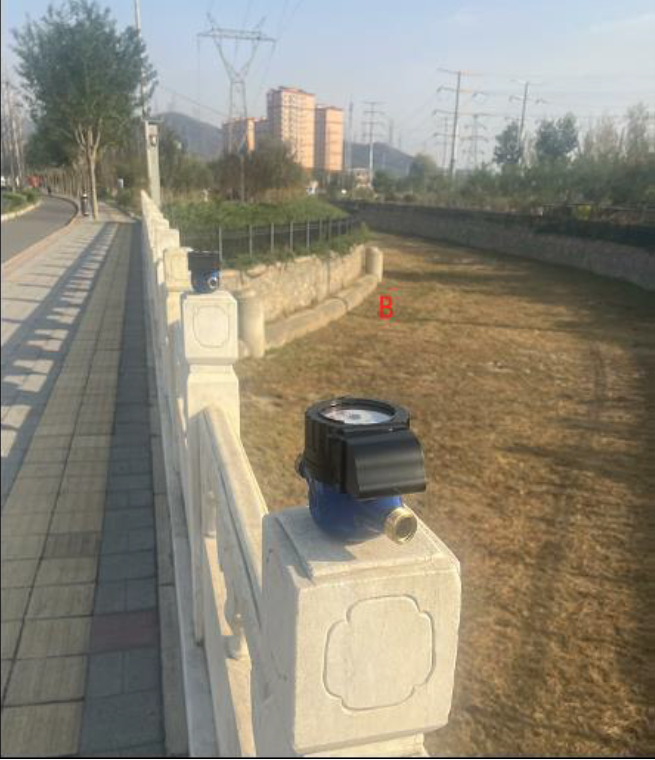
(Left) Figure 5: Gateway deployed at the top of a building (Middle) Figure 6: Water meters 001 and 002 on testing point A (Right) Figure 7: Water meter 001 on testing point B
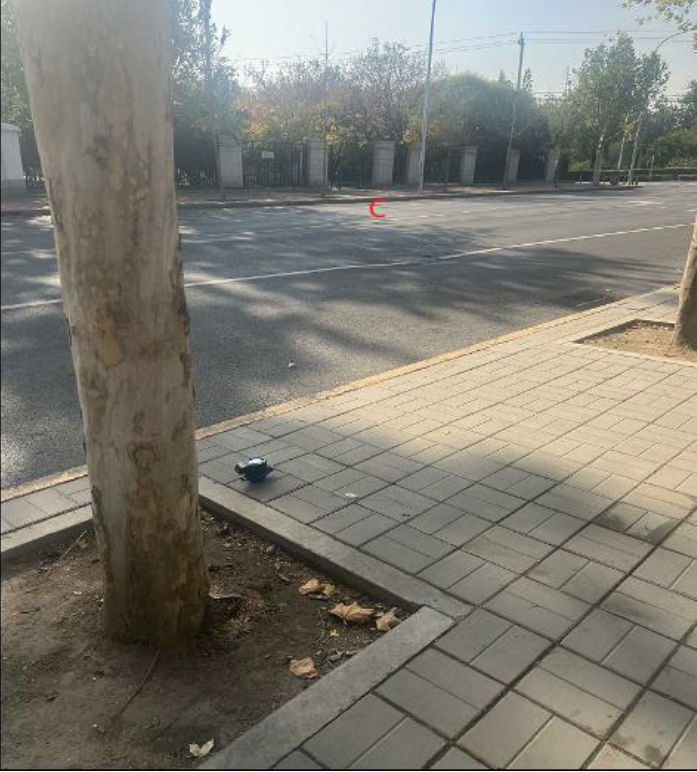
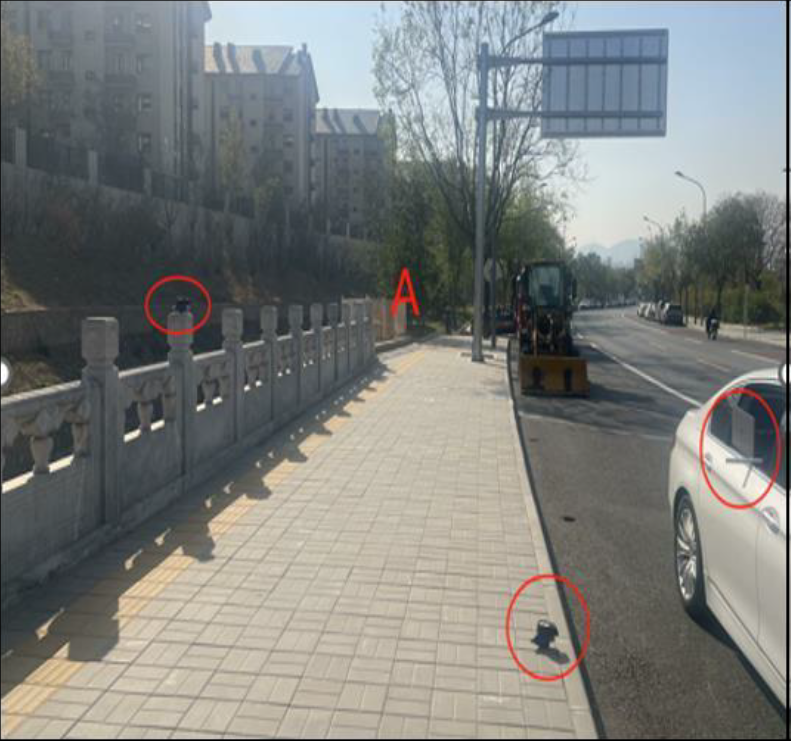
(Left) Figure 8: Water meter 001 on testing point C (Right) Figure 9: Water meters 001 and 002 on testing point D
Test Results for In-building Scenario
|
Building |
Floor |
Inside steel cabinet |
Avarage RSSI/SNR |
Packet loss rate |
|
Building 1 |
1 |
No |
-112/-7.5 |
0% |
|
5 |
No |
-123/-16.6 |
0% |
|
|
9 |
No |
-113/-7.1 |
0% |
|
|
14 |
Yes |
-122/-15.3 |
5% |
|
|
19 |
No |
-115/-8.9 |
0% |
|
|
Building
2 |
1 |
Yes |
-124/-12.8 |
10% |
|
4 |
Yes |
-114/-7.5 |
0% |
|
|
9 |
Yes |
-121/-14.2 |
5% |
|
|
13 |
No |
-114/-7.8 |
0% |
|
|
17 |
Yes |
-103/-1.7 |
0% |
|
|
Building 3 |
1 |
No |
-89/-5.8 |
0% |
|
3 |
No |
-98/3.8 |
0% |
|
|
7 |
Yes |
-90/5.6 |
0% |
|
|
12 |
No |
-89/5.7 |
0% |
|
|
19 |
Yes |
-107/-1.7 |
0% |
|
|
Building
4 |
1 |
Yes |
-120/-12.9 |
10% |
|
5 |
No |
-109/-3.7 |
0% |
|
|
11 |
Yes |
-104/4.6 |
0% |
|
|
16 |
No |
-109/-3.2 |
0% |
|
|
21 |
Yes |
-115/-8.9 |
0% |
|
|
Building
5 |
1 |
No |
-102/1.8 |
0% |
|
6 |
Yes |
-110/-4 |
0% |
|
|
15 |
Yes |
-102/-1.4 |
0% |
|
|
21 |
No |
-101/2.4 |
0% |
|
|
Building
6 |
1 |
No |
-95/4.7 |
0% |
|
4 |
No |
-102/2.5 |
0% |
|
|
8 |
No |
-97/4.1 |
0% |
|
|
14 |
Yes |
-95/4.4 |
0% |
|
|
21 |
Yes |
-96/4 |
0% |
|
|
Building
7 |
1 |
No |
-98/3.6 |
0% |
|
3 |
No |
-98/3.6 |
0% |
|
|
9 |
No |
-92/4.8 |
0% |
|
|
14 |
Yes |
-101/1.1 |
0% |
|
|
21 |
No |
-102/1 |
0% |
Table 1: Test results for in-building scenario
These results give a comprehensive view of the performance of the LoRaWAN network in different scenarios within the residential complex. They indicate how factors such as the presence of steel doors and the floor level impact signal strength (RSSI) and quality (SNR), as well as communication reliability as reflected in the packet loss rates.
Test Results for Street Scenario
|
Location |
Avarage RSSI/SNR water metter 001 |
Avarage RSSI/SNR watter metter 002 |
Packet loss rate |
|
A |
-89/4.88 |
-89.8/4.7 |
0% |
|
B |
-100.1/2.2 |
100.5/2.5 |
0% |
|
C |
-97.2/2.1 |
-96.8/1.9 |
0% |
|
D |
-108.7/-6.7 |
-109.1/-7.7 |
0% |
Table 2: Test results for street scenario
This table provides a side-by-side comparison of the signal quality and reliability of the LoRaWAN network for two water meters, based on RSSI and SNR values and the packet loss rate experienced during the tests. Both water meters show a 0% packet loss rate, indicating a reliable communication link under the tested conditions.
Conclusions
The findings from both scenarios show that the LoRaWAN network can maintain a robust communication link with water meter nodes at significant distances, even in challenging urban environments. In the in-building scenario, despite concrete structures and steel doors, the network achieved a notable success rate, with minimal packet loss. This indicates the network's effective penetration and reliability in a typical residential setup. In the street scenario, the network's performance was consistent, achieving a 0% packet loss rate over distances surpassing 5 km. This reinforces LoRaWAN's capability for wide-area coverage and its potential for extensive urban deployment of water meter applications. The robustness of signal strength and quality across various distances and obstacles suggests that LoRaWAN is well-suited for smart city IoT implementations. Future enhancements may focus on optimizing gateway positioning and exploring the benefits of enabling ADR to adapt to changing environmental conditions.
This report underscores the adaptability and strength of LoRaWAN networks in diverse urban environments and establishes a foundation for future IoT expansions in smart city infrastructure.


