How to Visualize Your Sensor Data on Datacake Using the Chirpstack Server
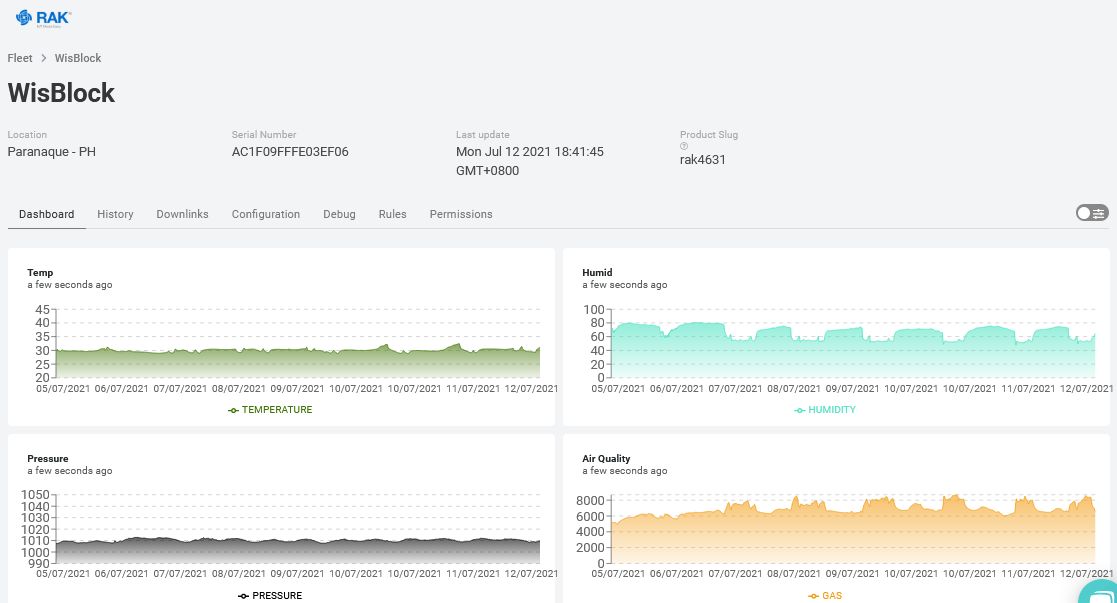 Datacake is a multi-purpose, low-code IoT platform that makes it quite easy to create a custom IoT application. I wanted to give it a try for a simple visualization of my WisBlock Environment application.
Here, I want to show you how simple it is to forward your sensor data from a WisBlock environment sensor node to Datacake and create the visualization.
What is not covered here:
- How to setup the WisBlock Environment sensor node. You can use the WisBlock Environment Monitoring example. I use exactly the same payload structure as in that example.
- How to connect the WisBlock node to a Gateway. Checkout RAK4631 Quick Start.
- How to setup the Chirpstack server and connect the Gateway to it. You can find a guide in the Chirpstack Quick Start.
- How to setup an application in Chirpstack and add your device to the application. This is shown in Chirpstack - Connecting a device.
- How to get a Datacake account (Datacake).
- How to run a Datacake application (Datacake Docs).
What I will show you here:
- How to setup the HTTP integration in the Chirpstack Server
- How to setup a device in your Datacake application
- How to create the data parser and data fields for your sensor node in Datacake
- How to setup your dashboard to visualize the incoming sensor data
Setup the HTTP Integration in the Chirpstack Server
Setting up the HTTP integration to forward data to Datacake is a piece of cake 😃 — literally.
Open your Chirpstack web interface and go to your application. (Again, here I assume you have already setup your Chirpstack server and created an application).
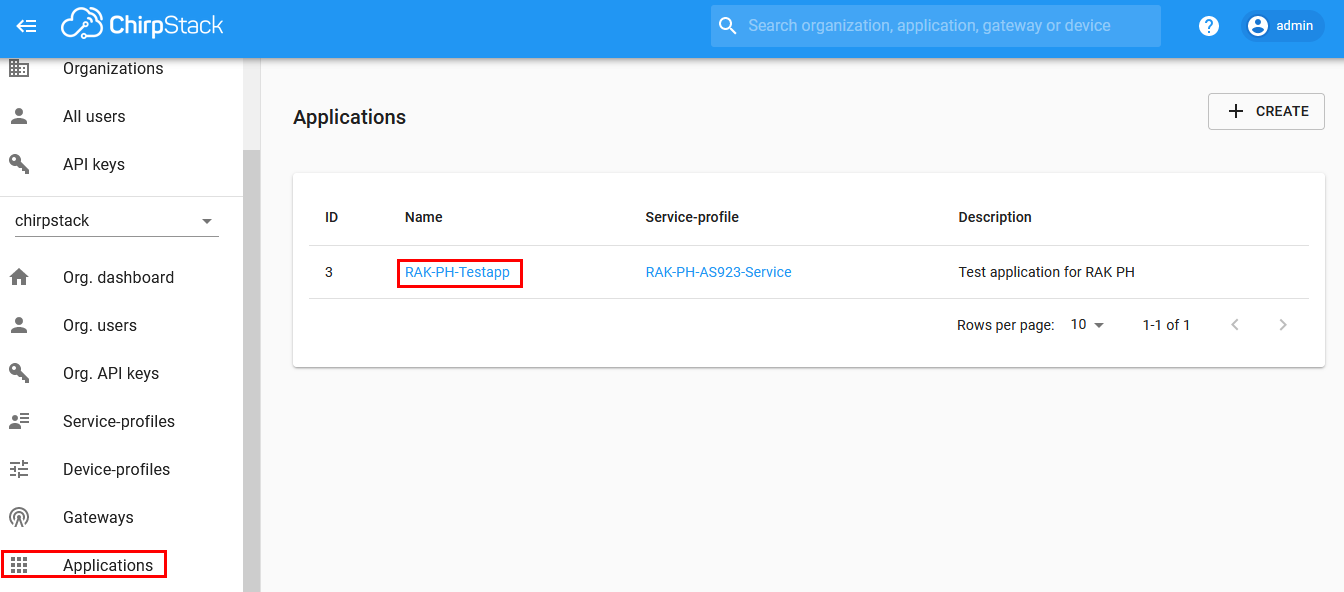
Open your application, so that you see all of your connected devices. At this point, you should write down the Device EUI of the node you want to connect to Datacake. You will need it later in Datacake!
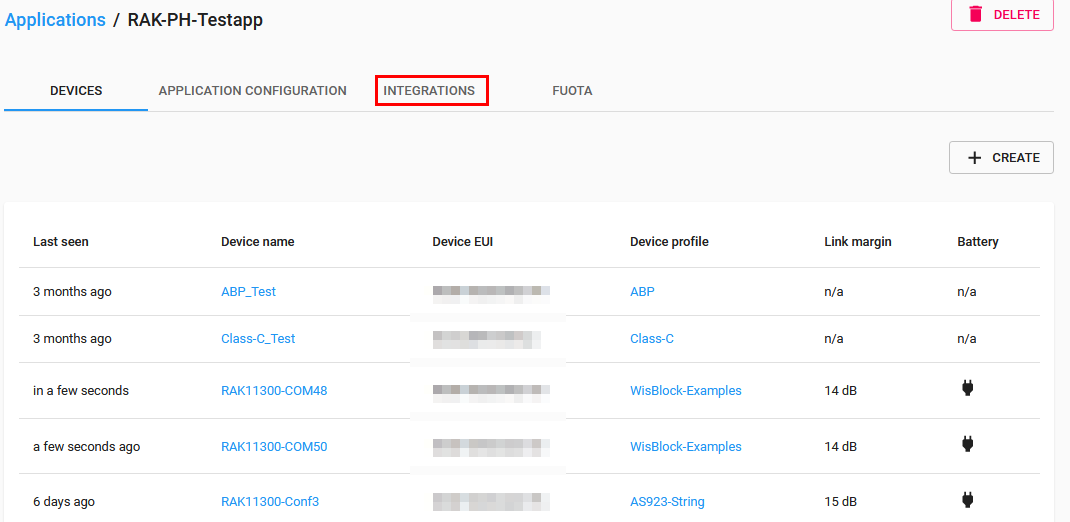
Select the Integrations tab. It will show you the integrations that Chirpstack has already implemented.
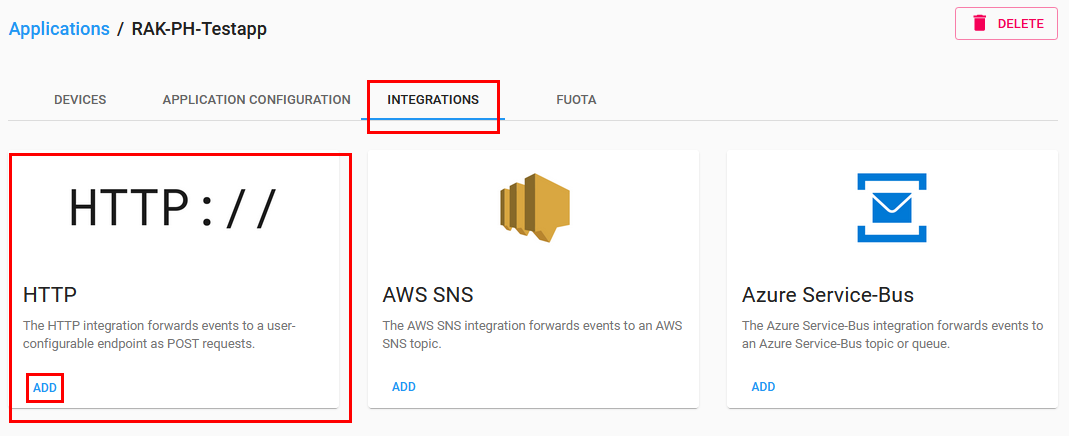
For Datacake, we will use the HTTP integration. Just click on the ADD button.
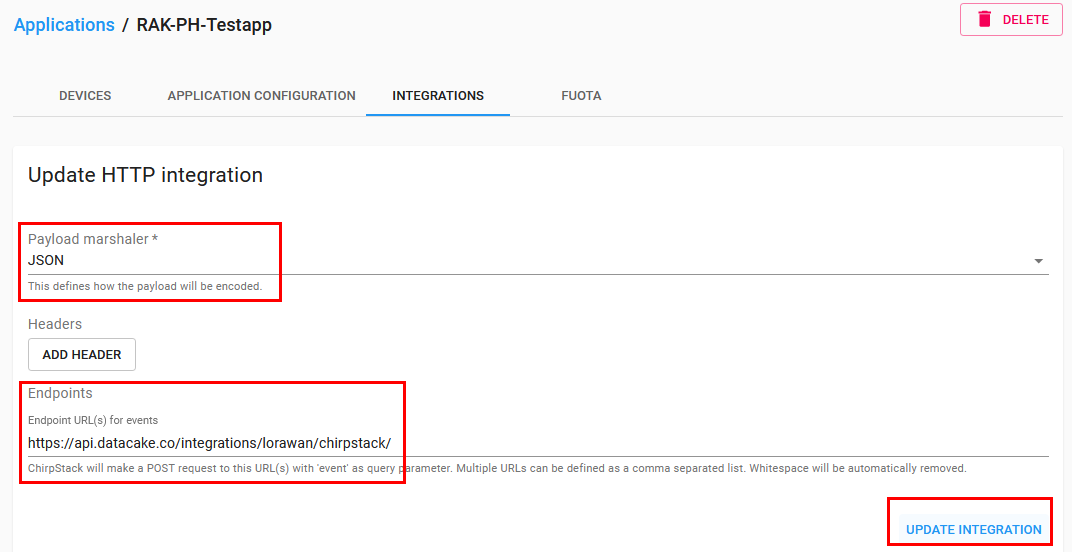
In the window that opens, we just have to do three things:
- Select
JSONas Payload marshaler. - Add the Datacake API URL
https://api.datacake.co/integrations/lorawan/chirpstack/. The URL's for other LPWAN servers can be found here: Datacake LPWAN Get Started. - Push the
UPDATE INTEGRATIONbutton.
And that's all — as I said, piece of cake. 🍰 😃
From now on, Chirpstack will forward the data coming from your sensor node to Datacake.
Now, it's time to setup your visualization.
Setup a Device in Your Datacake Application
Here, I assume that you have already setup your Datacake account, created your application, and are ready to add a device. If not, please go the documentation of Datacake. They have good tutorials on how to get everything up and running.
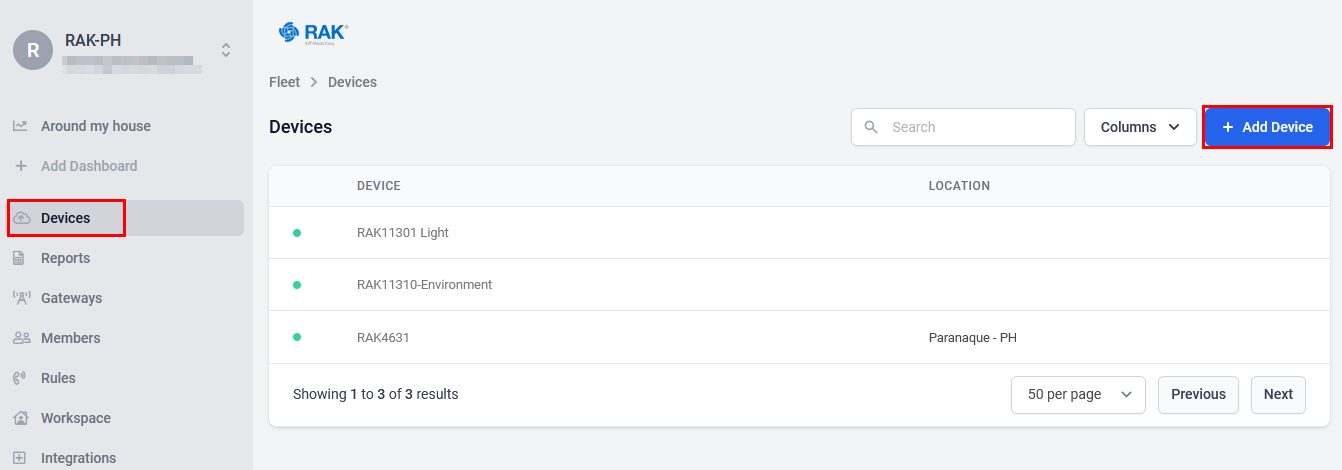
In the Datacake application, click on Devices to see an overview of your devices. Click on the Add Device button to start.
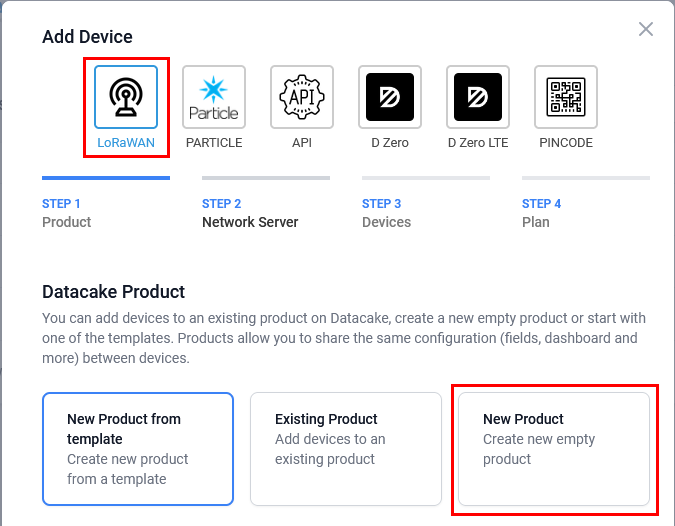
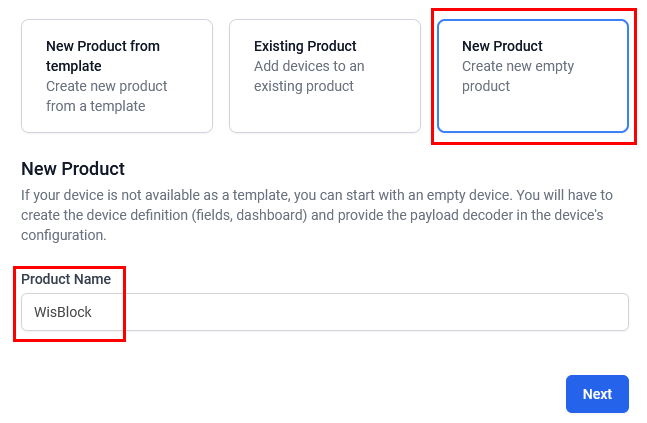
In the next screen, select LoRaWAN and New Product. RAKwireless WisBlock devices are not yet available as templates, but I hope this will change soon.
Add your Product Name and push the Next button.
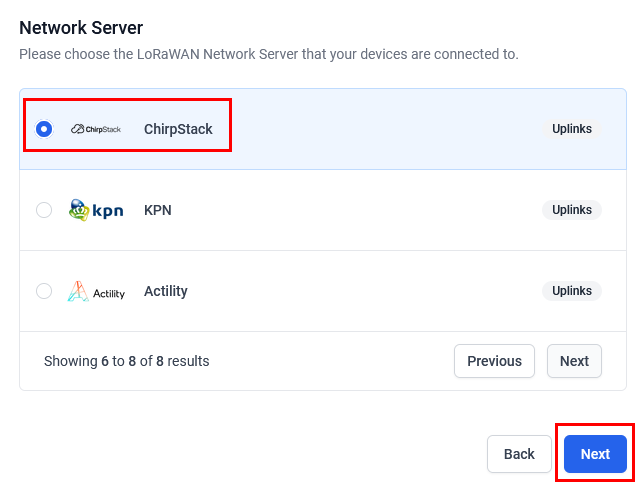
Then, scroll down the window until you see the Network Server section. Search for Chirpstack here, select it, and click the Next button.
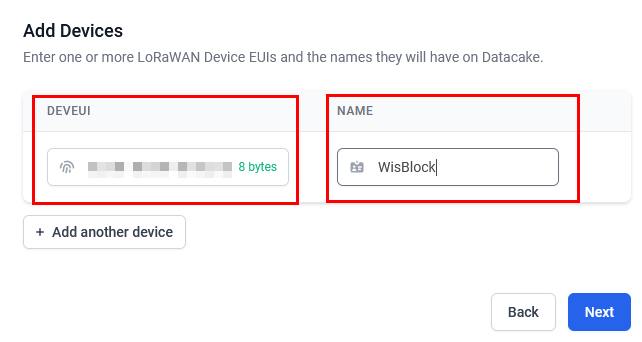
In the next step you have to enter the Dev EUI of your node and a name. The Dev EUI must match the node that you chose earlier in the Chirpstack Application. Once you have entered the information, hit the Next button again.
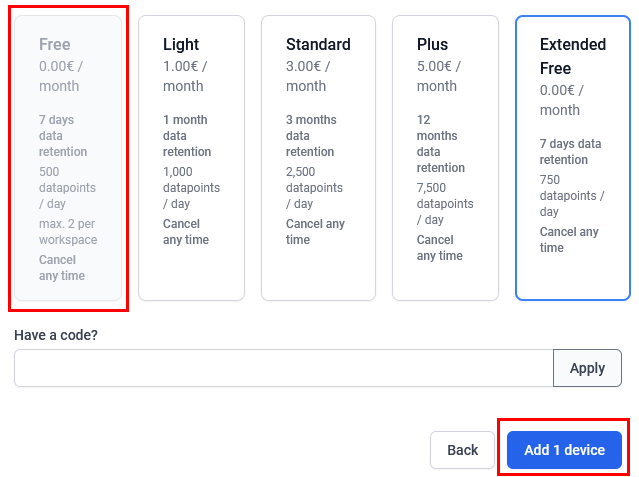
Depending your account at Datacake and how many devices you have already registered, select between the different payment options. Luckily for me, I had a coupon, which allowed me to use Extended Free for this new device. Once done here, push the Add 1 device button.
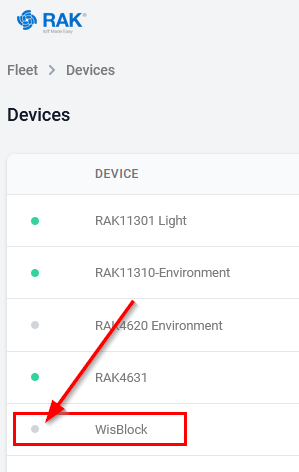
Okay, we're getting closer. You can now see the new device in the Devices overview screen of Datacake. It is not yet shown as connected because no valid data was received yet.
Create the Data Parser and Data Fields for Your Sensor Node in Datacake
To finish the configuration of the device, click on it in the overview. In the next window, select Configuration.

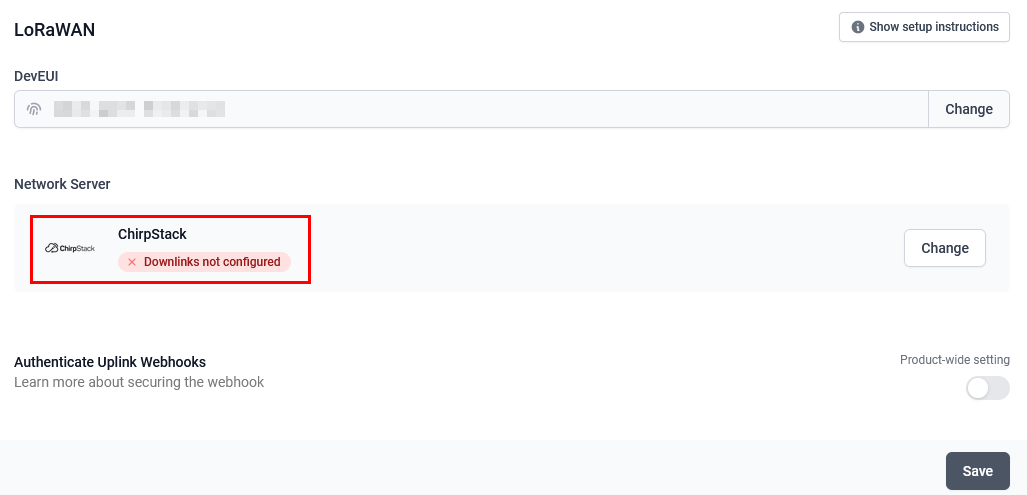
In configuration, scroll down until you see the LoRaWAN section. Verify here that the DevEUI is correct and that the Network Server is indeed Chirpstack.
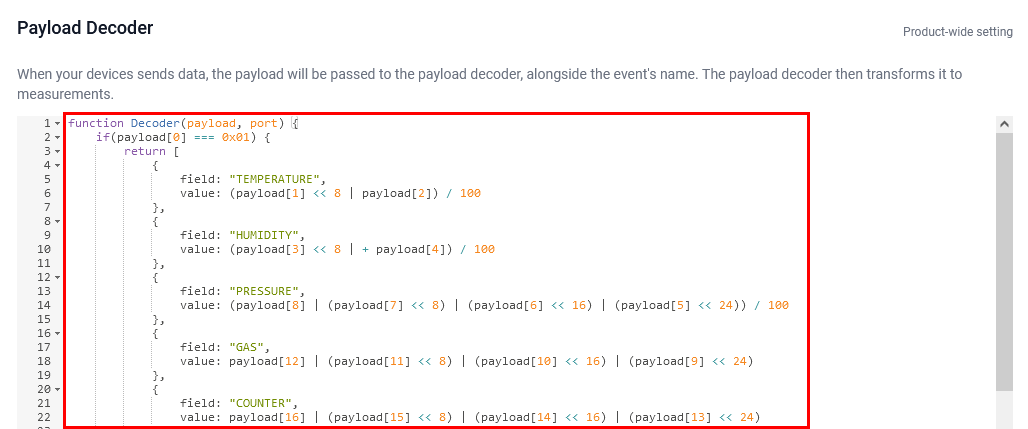
Continue to scroll down until you see the Payload Decoder section. Here, you'll have to enter our custom payload decoder for the arriving data. As you can see in the image, the decoder is returning a nested JSON array where each JSON entry has two fields: field and value. field will later be needed for the visualization and value is the sensor data.

To make things easier, I have a payload decoder prepared that will work with this example and can be easily extended to use with our other WisBlock Solutions.
To save you all the typing, I leave it here for you to copy and paste. Overwrite the example payload decoder with the following:
function Decoder(payload, port) {
    if(payload[0] === 0x01) {
        return [
            {
                field: "TEMPERATURE",
                value: (payload[1] << 8 | payload[2]) / 100
            },
            {
                field: "HUMIDITY",
                value: (payload[3] << 8 | + payload[4]) / 100
            },
            {
                field: "PRESSURE",
                value: (payload[8] | (payload[7] << 8) | (payload[6] << 16) | (payload[5] << 24)) / 100
            },
            {
                field: "GAS",
                value: payload[12] | (payload[11] << 8) | (payload[10] << 16) | (payload[9] << 24)
            },
            {
                field: "COUNTER",
                value: payload[16] | (payload[15] << 8) | (payload[14] << 16) | (payload[13] << 24)
            }
        ];
    }
    if(payload[0] === 0x02) {
        return [
            {
                field: "TEMPERATURE",
                value: (payload[1] << 8 | payload[2]) / 100
            },
            {
                field: "HUMIDITY",
                value: (payload[3] << 8 | + payload[4]) / 100
            },
            {
                field: "COUNTER",
                value: payload[8] | (payload[7] << 8) | (payload[6] << 16) | (payload[5] << 24)
            }
        ];
    }
    if(payload[0] === 0x03) {
        return [
            {
                field: "LIGHT",
                value: (payload[4] | (payload[3] << 8) | (payload[2] << 16) | (payload[1] << 24)) / 100
            },
            {
                field: "COUNTER",
                value: payload[8] | (payload[7] << 8) | (payload[6] << 16) | (payload[5] << 24)
            }
        ];
    }
    if(payload[0] === 0x04) {
        return [
            {
                field: "COUNTER",
                value: payload[4] | (payload[3] << 8) | (payload[2] << 16) | (payload[1] << 24)
            }
        ];
    }
}
Now, let's check if the decoder works. Scroll further down and hit the Save button to update the decoder.
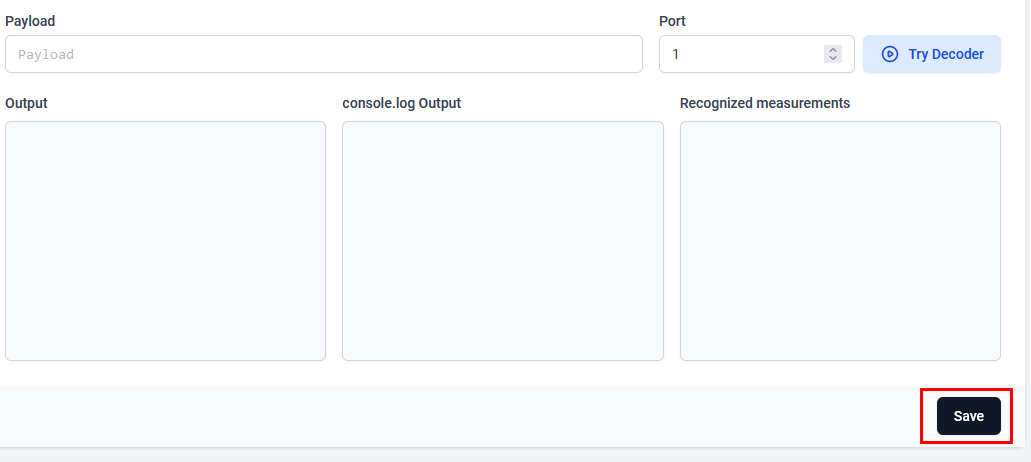
Then, scroll all the way up and select the Debug tab. If your device is online and already sending data, you can see the results of the decoder in the Debug Log.
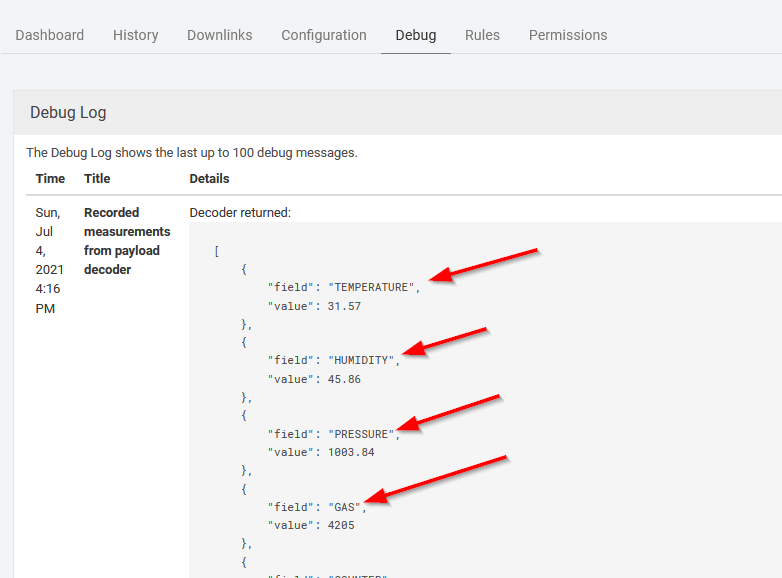
If that works, you'll next have to do some more entry work. Datacake uses the fields to find the correct data for the visualization, but you have to define all of the fields first.
Go back to the configuration tab and scroll down until you see the Fields section. Once you're there, click the Add Field button.
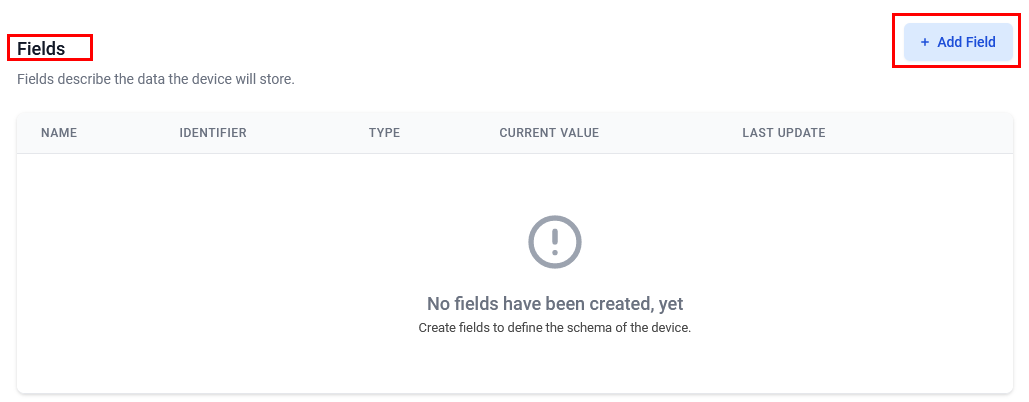
In the Add Field window, select the data type, name for the field, and unit.
Important: The Identifier must match the field name that is assigned in the payload decoder. So, for Temperature, the correct field name is TEMPERATURE.
After entering all information, hit the Add Field button.
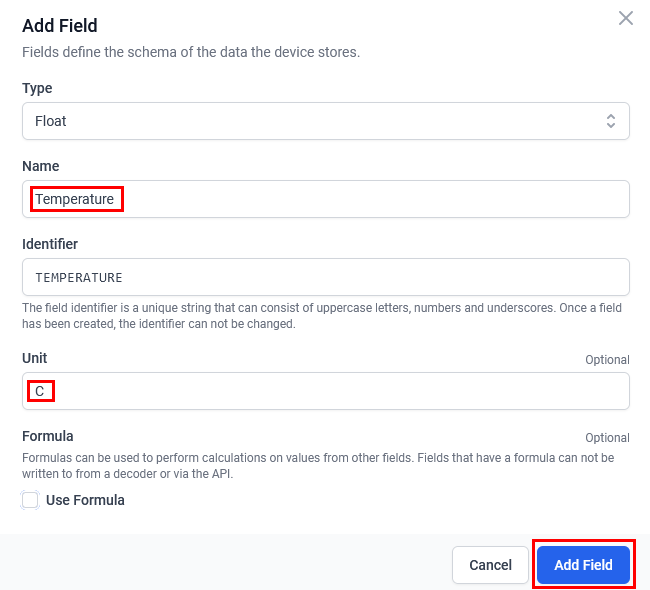
You have to repeat this step until you've defined all four fields that will contain the sensor data. In the end, your Fields section should look like this:
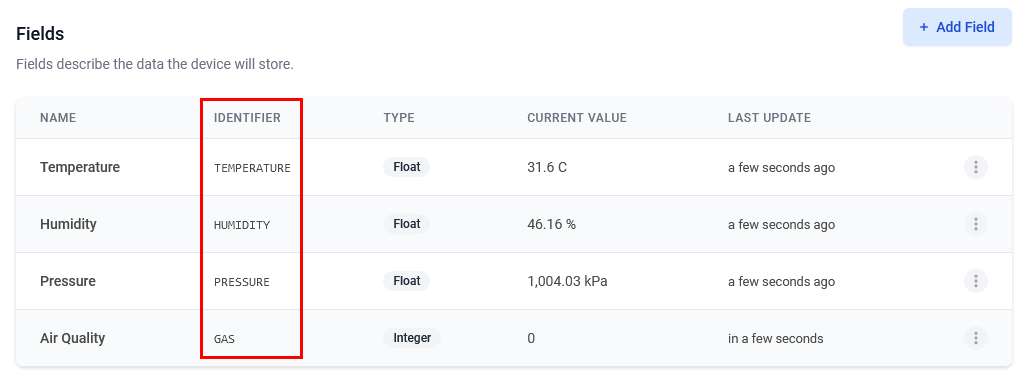
At this point, we're done with the preparations. Now, let's go and show the data with some nice charts.
Setup Your Dashboard to Visualize the Incoming Sensor Data
Get back to your device overview and open the Dashboard tab. For now, it's empty. To add a new widget, click on the small edit icon on the right side.

Now, you will see an Add Widget button. Click on it to start.

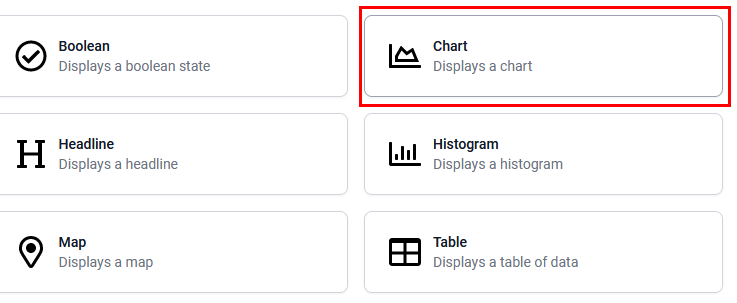
In the next screen, you'll see a selection of different visualization options. I chose Chart here.
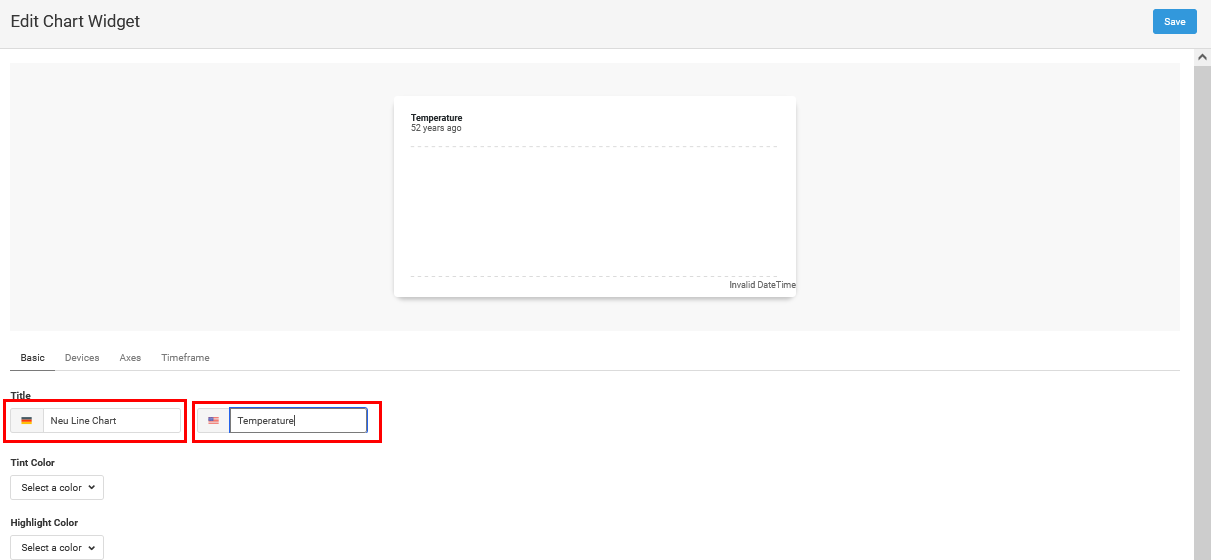
The next window has four tabs. Start with the Basic tab. You can enter the chart title here.
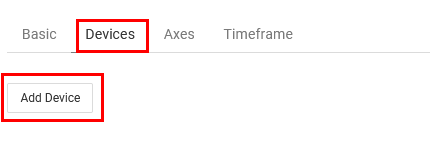
In the Devices tab, click on Add Device.
The window will extend and you can select the Field, which represents the data you want to visualize.
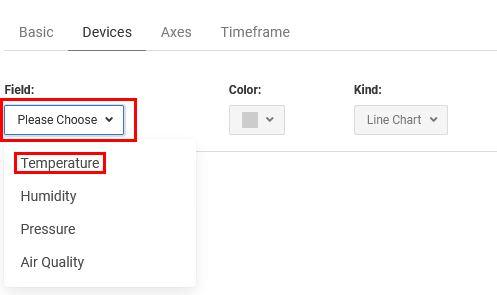
After selecting Temperature, you can choose a color for this data and change the display name (optional).

On the Axis tab, you can define the Unit of the data and set the MIN and MAX values to be displayed (optional). I left it here on 0 for the min value and auto for the max value.

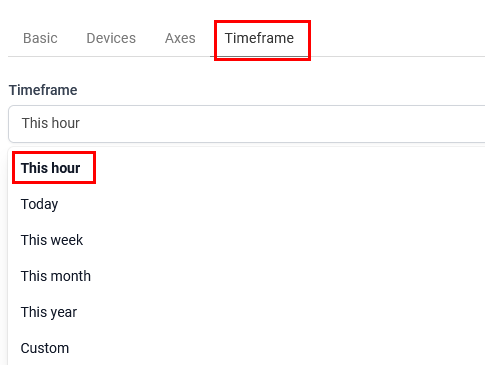
In the last tab—the Timeframe tab—you can set how much data should be displayed. Since we just started receiving data here, I chose This hour. You can change this later once more data is available.
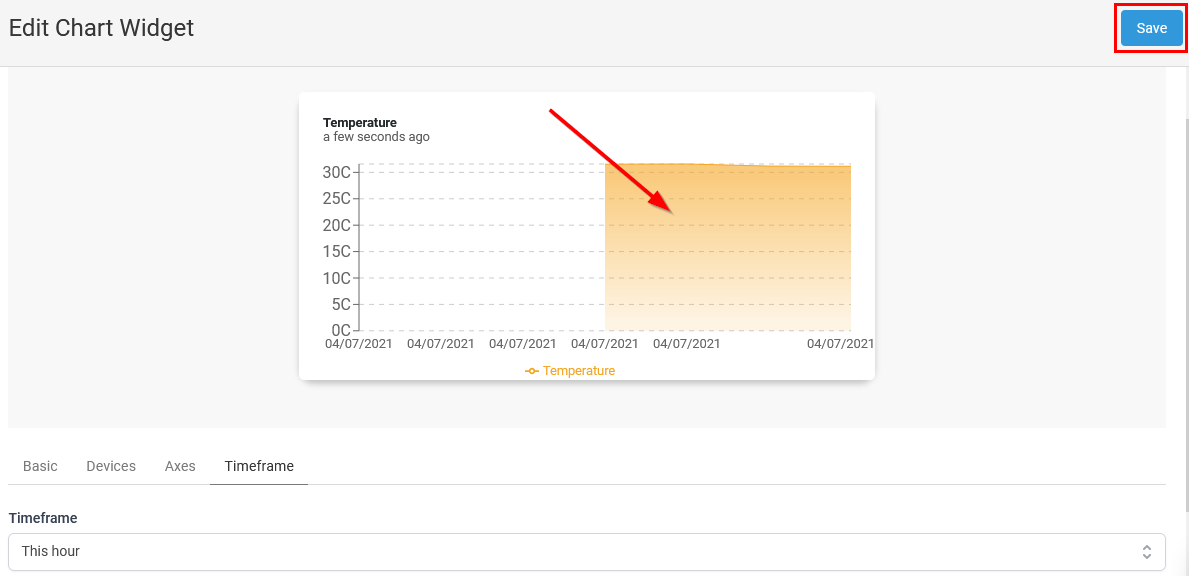
The preview will now already show some data. Click Save to go back to the dashboard edit window.
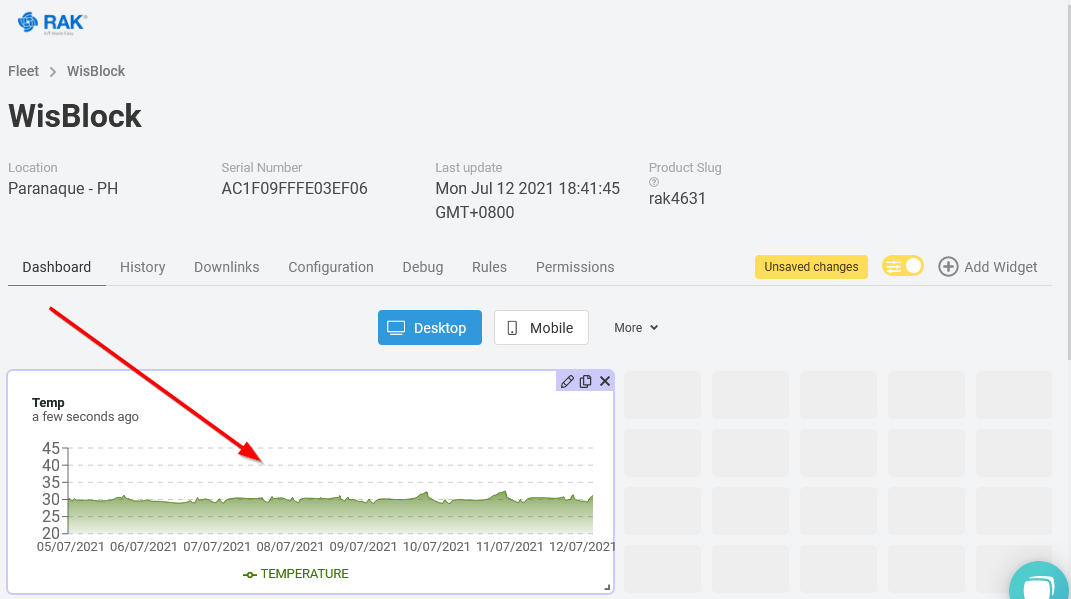
It will now show your first widget with the temperature data. You can resize it with the small arrow in the lower right corner of the widget.
After repeating these steps for other fields—Humidity, Pressure, and Air Quality— you can see the charts with the received data. Click on the yellow icon next to Unsaved changes to go save your work and go back to the main dashboard view.
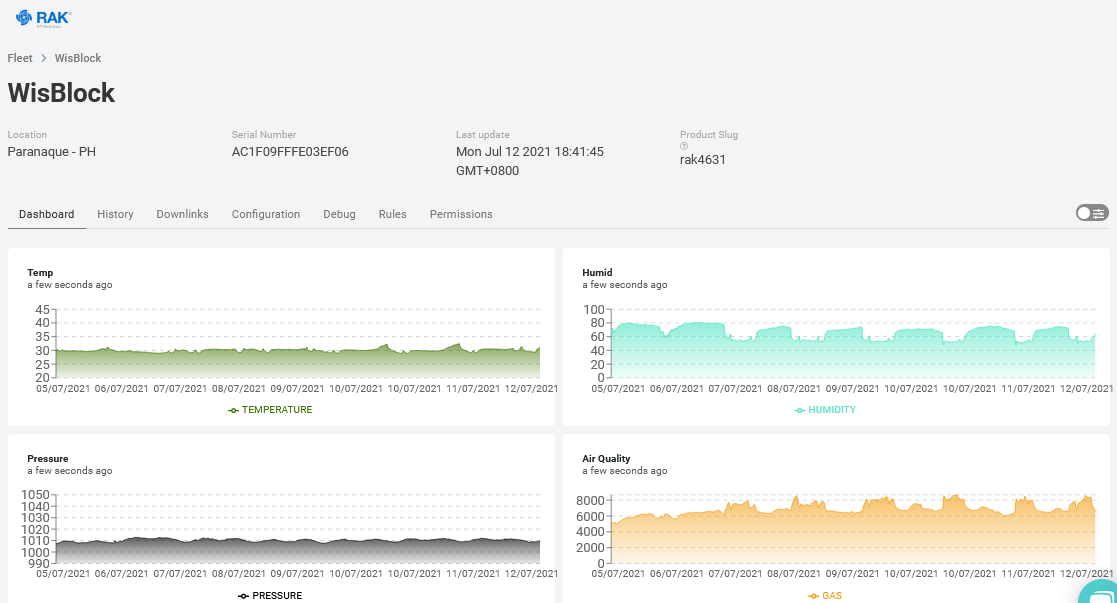
Well, RAKstars, that's all. Now, you have the data from your environment sensor in a nice visualization that you can access and see from anywhere.
I hope this short tutorial was helpful.


